
Financial statements discussion and analysis
Public Accounts of Canada 2024 Volume I—Top of the page Navigation
- Previous page: Section 1: Financial statements discussion and analysis
- Section 1: Table of contents: Section 1: Financial statements discussion and analysis
- Next page: Ten-year comparative financial information
Introduction
The Public Accounts of Canada is a major accountability report of the Government of Canada. This section, together with the other sections in this volume and in Volumes II and III of the Public Accounts of Canada, provides detailed supplementary information in respect of matters reported in the audited consolidated financial statements in Section 2 of this volume. Supplementary discussion and analysis of the financial results can be found in the Annual Financial Report of the Government of Canada—Fiscal Year 2023–2024, available on the Department of Finance Canada's website.
The consolidated financial statements and financial statements discussion and analysis have been prepared under the joint direction of the Minister of Finance, the President of the Treasury Board, and the Receiver General for Canada. Responsibility for the integrity and objectivity of the consolidated financial statements and financial statements discussion and analysis rests with the government. A glossary of terms used in this financial statements discussion and analysis is provided at the end of this section.
2024 financial highlights
- The final results for 2024 reflect transactions recorded by government departments and agencies up to March 31, 2024, and reported in the March Fiscal Monitor published by the Department of Finance in May 2024, plus post-March end-of-year adjustments to reflect the most up-to-date information available regarding the valuation of assets, such as loans and accounts receivable, and liabilities, including provisions for claims. The final results also incorporate accrued tax revenues based on assessments of tax returns completed after year-end and final results reported by Crown corporations, other government business enterprises, and other consolidated entities.
- Total revenues increased by $11.7 billion, or 2.6%, from 2023, reflecting strong labour market performance and resilient consumer spending. At the same time, income tax revenue decreased 0.7%, due mainly to lower corporate taxable income and income from non-residents.
- Program expenses excluding net actuarial losses increased by $28.1 billion, or 6.4%, from 2023, largely reflecting increases in transfers to individuals, especially elderly benefits, legislated growth in transfers to provinces, territories and municipalities, as well as other expenses, including provisions for presently unrecovered loans and benefits from support delivered during the COVID-19 pandemic. These increases were offset in part by lower other transfer payments.
- Public debt charges were up $12.3 billion, or 35.2%, largely reflecting an increase in the average effective interest rate on interest-bearing debt, offset in part by lower Consumer Price Index adjustments on Real Return Bonds.
- In 2024, the government recorded expenses totaling approximately $16.4 billion related to Indigenous contingent liabilities, in advancing its commitment to resolve past injustices and renew its relationship with Indigenous Peoples. In addition, the government recorded expenses totaling $4.7 billion related to COVID-19 pandemic expenses. Absent these expenses, the 2024 budgetary deficit would have been roughly $40.8 billion.
- The government posted an annual operating deficit of $61.9 billion for the fiscal year ended March 31, 2024, compared to a deficit of $35.3 billion in the previous fiscal year. The year-over-year increase in the deficit largely reflects increases in transfer payments, other expenses, including the categories noted above, and public debt charges, offset in part by growth in revenues.
- The annual operating deficit before net actuarial losses stood at $54.4 billion in 2024, compared to $25.7 billion in 2023. This measure is intended to supplement the traditional budgetary balance and improve the transparency of the government's financial reporting by isolating the impact of the recognition of net actuarial losses arising from the government's public sector pensions and other employee and veteran future benefits.
- The accumulated deficit (the difference between total liabilities and total assets), or federal debt, stood at $1,236.2 billion at March 31, 2024. The accumulated deficit-to-gross domestic product (GDP) ratio was 42.1%, up from 41.1% in the previous year. The government remains committed to its fiscal anchor of reducing the federal debt as a share of the economy over the medium term.
Accounting for Future Possible Developments
Since Budget 2024, the government identified significantly higher contingent liabilities, that is, possible obligations that have been assessed as likely to result in a future payment. While there were no payments associated with these new liabilities in the 2024 fiscal year, the federal government is following Canadian public sector accounting standards by transparently accounting for these estimated contingent liabilities in the 2024 financial results.
In 2024, the government recorded expenses totaling approximately $16.4 billion related to Indigenous contingent liabilities, in advancing its commitment to resolve past injustices and renew its relationship with Indigenous Peoples. In addition, the government recorded expenses totaling $4.7 billion related to COVID-19 pandemic expenses. Absent these expenses, the 2024 budgetary deficit would have been roughly $40.8 billion.
Budget 2024 projected revenues of $465.1 billion for the fiscal year ending March 2024, underpinned by economic data and strong year-to-date revenue results. Revenues for 2024 are $5.5 billion lower compared to the projection, due to lower tax revenue, consistent with the softening of the economy from higher interest rates as the Bank of Canada has returned inflation to 2%. This is a variance of 1.2% on total revenue of over $459.5 billion.
Budget 2024 projected total expenses of $505.1 billion for the fiscal year ending March 2024. Actual expenses were $16.3 billion2 higher than forecast in Budget 2024, due mainly to two factors:
- higher-than-anticipated provisions for contingent liabilities relating to Indigenous claims, and,
- provisions for presently unrecovered loans and benefits from support delivered during the COVID-19 pandemic.
The expense variance largely reflects the assessment and re-assessment by the government of assets and liabilities as required under its accrual accounting framework. That is, these are impacts from past transactions or in anticipation of possible future developments versus new in-year government spending.
Future Potential Payments to Resolve Indigenous Claims
The federal government is advancing reconciliation, supporting Indigenous Peoples' right to self-determination, and addressing historical wrongs and systemic racism. Since 2016, the government has provided over $60 billion to resolve Indigenous claims. Efforts are ongoing to resolve Indigenous claims, including through the prioritization of negotiations and work to resolve litigation out-of-court. These efforts have contributed to an increase in both the number and value of settlements in recent years.
"Contingent liabilities can be defined as possible obligations that may result in future payments when one or more future events occur or fail to occur. These events may not wholly be within the control of the government but may arise during the normal course of operations."
When the probability of a future payment is considered likely, and the amount can be estimated, the government records a provision for the contingent liability. The government cannot estimate with certainty when potential future contingent liabilities would be paid, or if they would be paid at all, as settlements are matters being negotiated with other parties or are before the courts.
"The current stock of the outstanding provision for contingent liabilities, as of March 31, 2023, is $76 billion. This amount has increased significantly in recent years, with an average annual growth of roughly 30 per cent since 2016."
As part of advancing its commitment to resolve past injustices by accelerating the resolution of Indigenous claims, the government recorded expenses of $17.8 billion in 2024, of which $16.4 billion is related to contingent liabilities for Indigenous claims. The remainder represents settlement payments not previously charged to expenses.
Emergency Pandemic Support for Canadians and Small Businesses
During the pandemic, the government delivered unprecedented programs to support the hardest-hit Canadians and businesses to weather the COVID-19 recession. The government secured a national supply of vital vaccines to reopen the economy as soon as possible. The Canada Recovery Benefit provided financial support to employed and self-employed Canadians who were directly affected by COVID-19 during public health restrictions. The Canada Emergency Business Account provided interest-free, partially forgivable loans to nearly 900,000 small business and not-for-profit organizations. The federal government supported Canadians when they needed it the most.
This support was crucial to Canada's remarkable economic resilience and recovery—and it did involve significant financial costs. While largely now passed, there is a diminishing amount of pandemic legacy costs. The government has recorded $1.2 billion in 2024 for the write-down by the Public Health Agency of Canada of expired COVID-19 vaccines and therapeutics. In addition, a $3.5-billion provision in 2024 has been recorded for loans and receivables related to the emergency support which kept Canadian workers and businesses afloat through the pandemic recession. The government is using a firm but fair approach to recover pandemic-era public funds where repayment is expected. This provision will be adjusted as appropriate as more repayment information becomes available.
Discussion and analysis
Economic context1
The Canadian economy has proved resilient to challenging global conditions in the wake of Russia's invasion of Ukraine and in the face of rapid and substantial increases in interest rates. Canada avoided the recession expected by many forecasters with real GDP rising 1.5% in 2023 following strong growth of 4.2% in 2022. As of the end of 2023, real GDP stood 6.4% above 2019 levels, the second fastest recovery among G7 economies behind the U.S.
Job creation eased in 2023, though remained strong. An additional 475,000 Canadians gained jobs in 2023, down from an increase of 750,000 in 2022. This gain in employment was outpaced by a significant increase in the labour force due to strong population growth. Along with slowing labour demand, this has contributed to a rise in the unemployment rate from multi-decade lows. After reaching lows of about 5% in the summer of 2022, the unemployment rate increased to 5.4% on average in 2023, and more recently to 6.5% in October 2024. While hiring has slowed, this has occurred without significant layoffs. Further, wage growth has outpaced inflation for twenty straight months as of September 2024. On average, real wages—wages after accounting for inflation—are now higher than they were just prior to the pandemic, up roughly 5.0% since 2019.
Canada has also made substantial progress in bringing inflation down in 2023. Inflation declined from 5.9% at the start of the year to 3.4% by the end of 2023. Inflation has since returned to the Bank of Canada's target of 2% in August 2024 after 41 consecutive months above 2%, and stood at 1.6% as of September 2024, the lowest inflation rate since February 2021. The main drivers of the initial surge in inflation have abated. Energy price declines and easing tensions in global supply chains have helped reduce headline inflation. Higher borrowing costs have also started to cool domestic demand after a series of large interest rate increases by the Bank of Canada. Still, underlying price pressures and the inflation rate for shelter remained elevated throughout 2023.
With inflation above target in 2023, the Bank of Canada raised its policy rate three times over the course of the year, up from 4.25% at the beginning of the year to 5.0% by July 2023. This was the highest policy rate since 2001. Since then, with inflation continuing to decline and economic activity soft, the Bank of Canada became the first G7 central bank to begin normalizing policy when it cut its policy rate by 25 basis points in June 2024. The move was followed by two additional 25 basis points cuts at the July and September meetings, as well as a larger 50 basis points cut at the October meeting, bringing the policy rate to 3.75%.
After surging in 2022 following Russia's invasion of Ukraine, commodity prices eased throughout 2023, helped by the dissipation of global supply chain disruptions. Paired with the cooling in domestic price pressures and slower real GDP growth, this led to a more modest gain in nominal GDP, the broadest measure of the tax base, of 2.9% in 2023 following two years of double-digit growth.
So far in 2024, the Canadian economy has continued to perform better than expected and is on track to achieve a soft landing. Inflation has continued to decline, and business and household balance sheets remain relatively healthy despite still-elevated interest rates and the softening in the labour market.
Looking ahead, forecasters expect that inflation will remain around the 2% target, which could give the Bank of Canada room to bring interest rates down further, albeit to a level above their pre-pandemic low. Real GDP growth is expected to remain moderate in the second half of 2024 before picking up in 2025 and beyond, growing in line with the economy's capacity at around 2%.
The government regularly surveys private sector economists on their views on the economy to assess and manage risk. The survey of private sector economists has been used as the basis for economic and fiscal planning since 1994 and introduces an element of independence into the government's forecasts.
| 2022 | 2023 | 2024 | 2025 | |
|---|---|---|---|---|
| Real GDP growth | ||||
| Budget 2023 | 3.4 | 0.3 | 1.5 | 2.3 |
| Budget 2024 | 3.8 | 1.1 | 0.7 | 1.9 |
| Actual | 4.2 | 1.5 | – | – |
| Nominal GDP growth | ||||
| Budget 2023 | 11.0 | 0.9 | 3.6 | 4.3 |
| Budget 2024 | 11.8 | 2.7 | 3.8 | 3.9 |
| Actual | 12.4 | 2.9 | – | – |
| 3-month Treasury bill rate | ||||
| Budget 2023 | 2.4 | 4.4 | 3.3 | 2.6 |
| Budget 2024 | 2.3 | 4.8 | 4.5 | 3.1 |
| Actual | 2.3 | 4.8 | – | – |
| 10-year government bond rate | ||||
| Budget 2023 | 2.8 | 3.0 | 2.9 | 3.0 |
| Budget 2024 | 2.8 | 3.3 | 3.3 | 3.2 |
| Actual | 2.8 | 3.3 | – | – |
| Unemployment rate | ||||
| Budget 2023 | 5.3 | 5.8 | 6.2 | 6.0 |
| Budget 2024 | 5.3 | 5.4 | 6.3 | 6.3 |
| Actual | 5.3 | 5.4 | – | – |
| Consumer price index inflation | ||||
| Budget 2023 | 6.8 | 3.5 | 2.1 | 2.1 |
| Budget 2024 | 6.8 | 3.9 | 2.5 | 2.1 |
| Actual | 6.8 | 3.9 | – | – |
The budgetary balance
The budgetary balance, or annual operating surplus/deficit, is the difference between the government's revenues and total expenses over a fiscal year. It is one of the key measures of the government's annual financial performance. The government posted an annual operating deficit of $61.9 billion in 2024, compared to a deficit of $35.3 billion in 2023.
The annual operating deficit before net actuarial losses represents the difference between the government's revenues and expenses excluding net actuarial losses. By excluding the impact of changes in the estimated value of the government's obligations and assets for public sector pensions and other employee and veteran future benefits recorded in previous fiscal years, this measure is intended to present a clearer picture of the results of government operations during the current fiscal year. The annual operating deficit before net actuarial losses stood at $54.4 billion in 2024, compared to $25.7 billion in 2023.
The following graph shows the government's budgetary balance since 1984, as well as the budgetary balance before net actuarial losses since 2009. To enhance the comparability of results over time and across jurisdictions, the budgetary balance and its components are presented as a percentage of GDP. In 2024, the annual operating deficit was 2.1% of GDP, compared to a deficit of 1.2% of GDP a year earlier. The annual operating deficit before net actuarial losses was 1.9% of GDP, compared to a deficit of 0.9% of GDP a year earlier.
Annual operating surplus/deficit
(percentage of GDP)
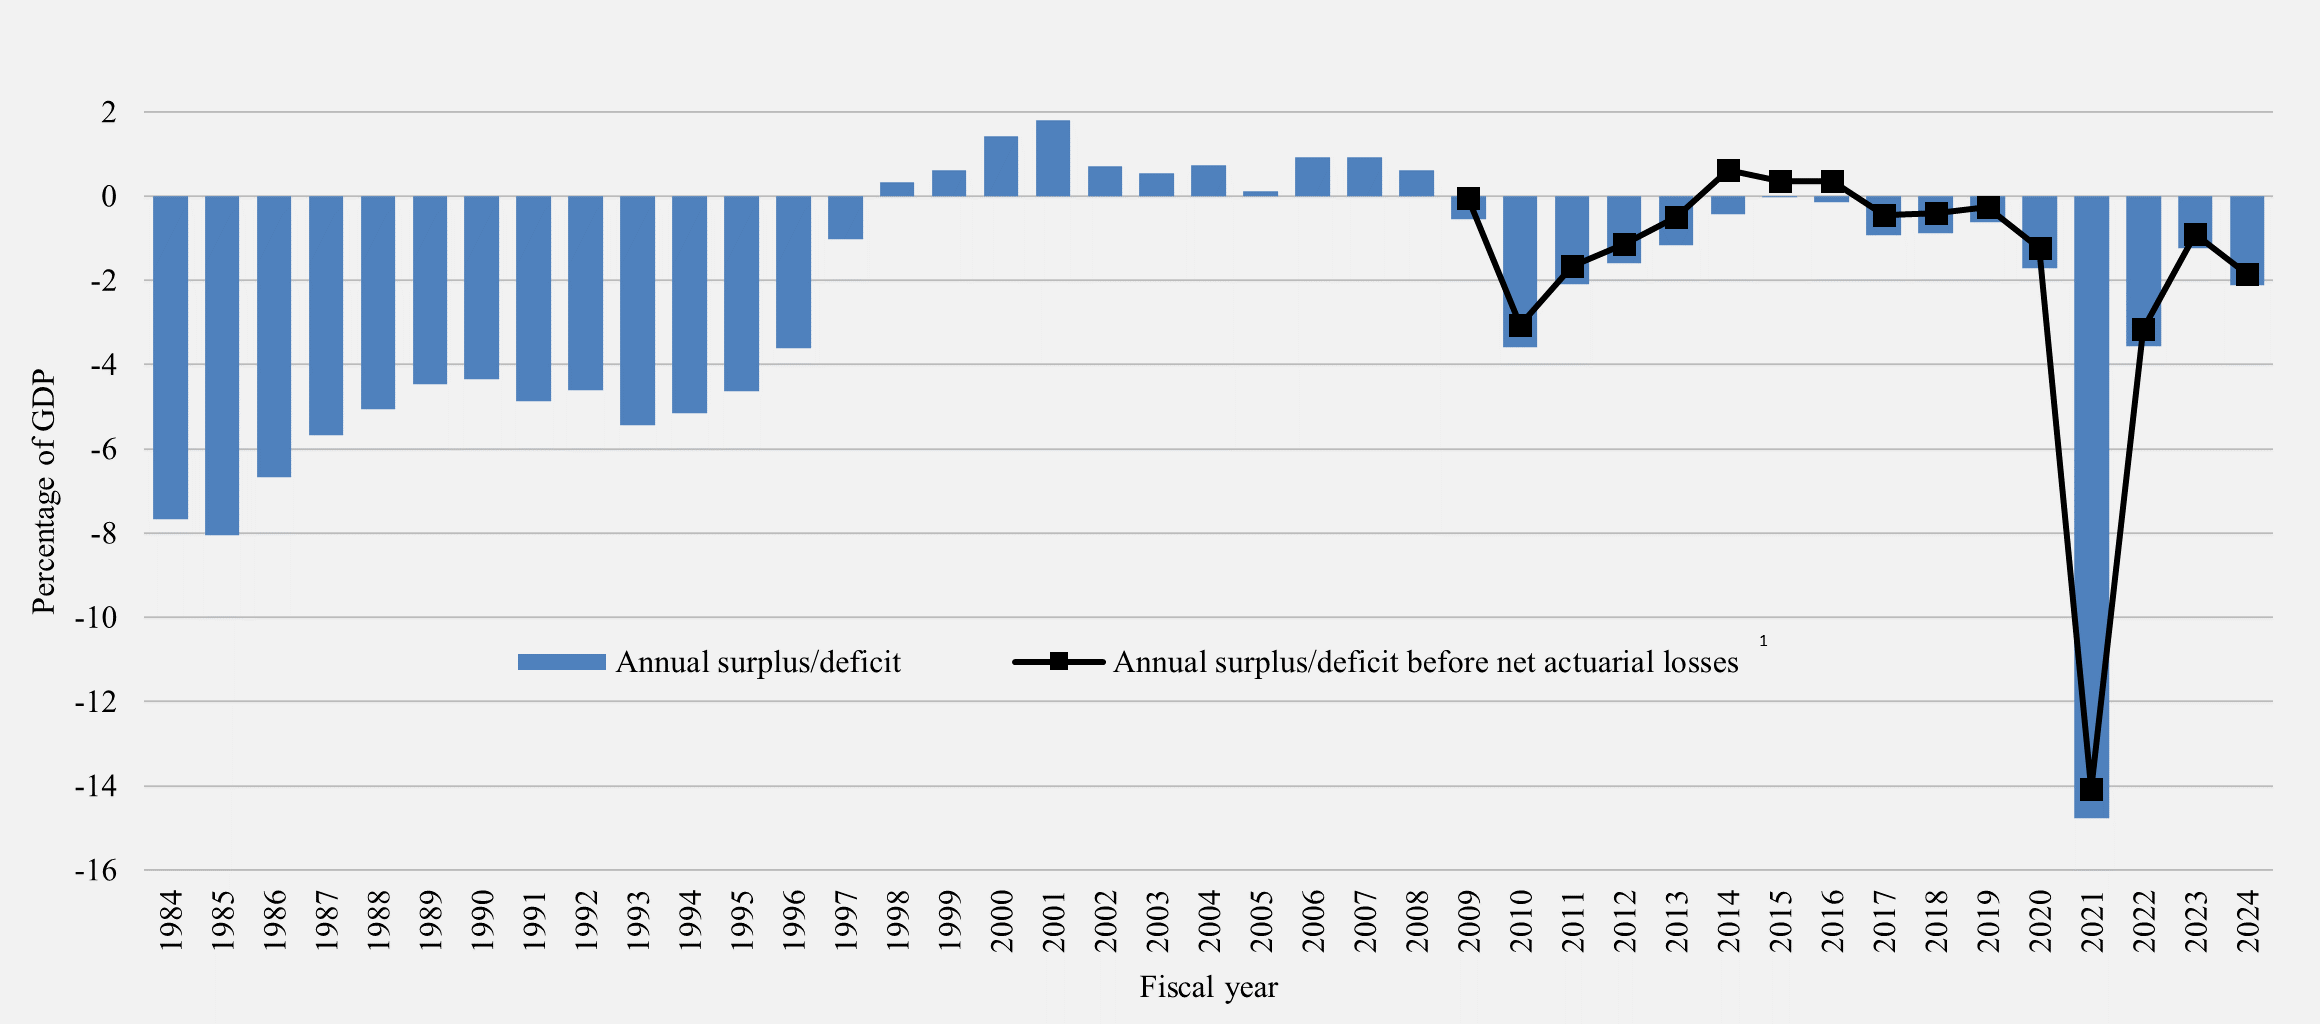
Image description
| Fiscal year | Annual surplus/deficit | Annual surplus/deficit before net actuarial lossesLinks to footnote 1 in table 2 |
|---|---|---|
| 1984 | (negative 7.7) | |
| 1985 | (negative 8.0) | |
| 1986 | (negative 6.7) | |
| 1987 | (negative 5.7) | |
| 1988 | (negative 5.1) | |
| 1989 | (negative 4.5) | |
| 1990 | (negative 4.3) | |
| 1991 | (negative 4.9) | |
| 1992 | (negative 4.6) | |
| 1993 | (negative 5.4) | |
| 1994 | (negative 5.2) | |
| 1995 | (negative 4.6) | |
| 1996 | (negative 3.6) | |
| 1997 | (negative 1.0) | |
| 1998 | 0.3 | |
| 1999 | 0.6 | |
| 2000 | 1.4 | |
| 2001 | 1.8 | |
| 2002 | 0.7 | |
| 2003 | 0.6 | |
| 2004 | 0.7 | |
| 2005 | 0.1 | |
| 2006 | 0.9 | |
| 2007 | 0.9 | |
| 2008 | 0.6 | |
| 2009 | (negative 0.6) | 0.0 |
| 2010 | (negative 3.6) | (negative 3.1) |
| 2011 | (negative 2.1) | (negative 1.7) |
| 2012 | (negative 1.6) | (negative 1.1) |
| 2013 | (negative 1.2) | (negative 0.5) |
| 2014 | (negative 0.4) | 0.6 |
| 2015 | 0.0 | 0.4 |
| 2016 | (negative 0.1) | 0.4 |
| 2017 | (negative 0.9) | (negative 0.4) |
| 2018 | (negative 0.9) | (negative 0.4) |
| 2019 | (negative 0.6) | (negative 0.3) |
| 2020 | (negative 1.7) | (negative 1.2) |
| 2021 | (negative 14.8) | (negative 14.1) |
| 2022 | (negative 3.6) | (negative 3.2) |
| 2023 | (negative 1.24) | (negative 0.9) |
| 2024 | (negative 2.1) | (negative 1.9) |
Revenues were up $11.7 billion, or 2.6%, from the prior year, primarily reflecting an increase in personal income tax and Goods and Services Tax (GST) revenues, supported by strong labour markets and robust consumer spending. This increase was offset by lower corporate and non-resident income tax revenues (with total income tax revenues down $2.3 billion, or 0.7%).
Total expenses were up $38.3 billion, or 7.9%, from the prior year. Program expenses excluding net actuarial losses increased by $28.1 billion, or 6.4%, primarily reflecting an increase in transfers to individuals, especially elderly benefits, legislated growth in transfers to provinces, territories and municipalities, as well as other expenses, including provisions for presently unrecovered loans and benefits from support delivered during the COVID-19 pandemic. These increases were offset in part by lower other transfer payments.
Net actuarial losses decreased by $2.1 billion, or 22.2%, from the prior year, largely reflecting the amortization of actuarial gains arising in 2023.
Public debt charges increased by $12.3 billion, or 35.2%, from the prior year, largely reflecting an increase in the average effective interest rate on interest-bearing debt, offset in part by lower Consumer Price Index adjustments on Real Return Bonds.
| 2024 | 2023 | |
|---|---|---|
| Consolidated Statement of Operations | ||
| Revenues | 459,549 | 447,815 |
| Expenses | ||
| Program expenses, excluding net actuarial losses | 466,663 | 438,555 |
| Public debt charges | 47,273 | 34,955 |
| Total expenses, excluding net actuarial losses | 513,936 | 473,510 |
| Annual operating deficit before net actuarial losses | (negative 54,387) | (negative 25,695) |
| Net actuarial losses | (negative 7,489) | (negative 9,627) |
| Annual operating deficit | (negative 61,876) | (negative 35,322) |
| Percentage of GDP | (2.1%) | (1.2%) |
| Consolidated Statement of Financial Position | ||
| Liabilities | ||
| Accounts payable and accrued liabilities | 264,056 | 259,440 |
| Interest-bearing debt | 1,745,489 | 1,616,753 |
| Foreign exchange accounts liabilities | 44,106 | 44,151 |
| Derivatives | 4,131 | 4,689 |
| Total liabilities | 2,057,782 | 1,925,033 |
| Financial assets | 705,028 | 642,276 |
| Net debt | (negative 1,352,754) | (negative 1,282,757) |
| Non-financial assets | 116,603 | 109,744 |
| Accumulated deficit | (negative 1,236,151) | (negative 1,173,013) |
| Percentage of GDP | 42.1% | 41.1% |
Annual operating deficit before net actuarial losses
Actuarial losses and gains arise from the annual remeasurement of the government's existing obligations for public sector pensions and other employee and veteran future benefits, as well as differences between actual and expected returns on pension assets. The measurement of these obligations and expected returns on pension assets involves the extensive use of estimates and assumptions about future events and circumstances, such as discount rates, future inflation, returns on investments, general wage increases, workforce composition, retirement rates, and mortality rates. In particular, the unfunded obligations are sensitive to changes in both short- and long-term interest rates, which are used to estimate the value of expected future benefit payments in today's dollars. Unfunded benefit obligations are discounted based on the spot rates of Government of Canada bonds at fiscal year-end (March 31), which can fluctuate significantly from one year to the next, resulting in actuarial gains and losses that flow through the budgetary balance.
While these adjustments and revaluations are an important part of providing an accurate picture of the government's Consolidated Statement of Financial Position at a given time, they can also result in large swings in the budgetary balance, which may impair the usefulness and understandability of the government's consolidated financial statements and fiscal projections, including as a measurement of the short-term impact of government spending and taxation choices on the economy.
The annual operating deficit before net actuarial losses isolates the impact of adjustments and remeasurements of previously recorded public sector pensions and other employee and veteran future benefits and provides a clearer view of the government's planned and actual operating activities in an accounting period, with the aim of enhancing transparency and accountability.
Elimination of interest on Canada Student Loans
In 2023, the government decided to permanently eliminate interest on all Canada Student Loans, effective April 1, 2023. These loans were already under a temporary interest holiday for a period of two years. The change was enacted through the Fall Economic Statement Implementation Act, 2022, which received Royal Assent on December 15, 2022.
The elimination of interest by the government through this restructuring represents a significant concessionary term granted to borrowers. Under the government's accounting policy, loans that are restructured with significant concessionary terms are recognized at the time of restructuring, with an associated charge to transfer payment expense.
During the preparation of the March 31, 2024, consolidated financial statements, the restructuring date of these loans was further analyzed. Professional judgement was exercised to determine whether the concessionary component of the loans should have been recorded in the prior fiscal year, which would align with the period in which the decision was made by the government, and when the Canada Student-Loans-Act was amended. The government recorded the expense in 2024, however, if this transfer payment expense had been recorded in 2023 it would have increased the annual operating deficit in that year by $3.2 billion and reduced the annual operating deficit in 2024 by $3.3 billion.
Revenues
The government's revenues include proceeds received or receivable from exchange transactions, such as from the sales of goods and services, and from non-exchange transactions, such as tax revenues, where the amount of revenue earned is not as easily observed during the fiscal year. Due to their nature, the measurement of tax revenues is generally subject to a higher degree of measurement uncertainty. In developing the government's best estimates, the methodology for estimating tax revenues incorporates assessments/reassessments of tax returns completed after year-end as well as estimates of amounts not yet assessed/reassessed based on cash received that relates to the fiscal year ended March 31.
Federal revenues can be broken down into five main categories: income tax revenues, other taxes and duties, Employment Insurance (EI) premium revenues, pollution pricing proceeds, and other revenues.
Within the income tax category, personal income tax revenues are the largest source of federal revenues and accounted for 47.4% of total revenues in 2024 (up from 46.4% in 2023). Corporate income tax revenues are the second largest source of revenues and accounted for 17.9% of total revenues in 2024 (down from 21.0% in 2023). Non-resident income tax revenues are a comparatively smaller source of revenues, accounting for only 2.7% of total revenues in 2024 (down from 2.9% in 2023).
Other taxes and duties consist of revenues from the GST, energy taxes, customs import duties, and other excise taxes and duties. The largest component of this category—GST revenues—accounted for 11.2% of all federal revenues in 2024 (up from 10.3% in 2023). The share of the remaining components of other taxes and duties stood at 3.9% of total federal revenues (down from 4.1% in 2023).
EI premium revenues accounted for 6.4% of total federal revenues in 2024 (up from 6.0% in 2023).
Pollution pricing proceeds from the federal carbon pollution pricing framework accounted for 2.3% of total federal revenues in 2024 (up from 1.8% in 2023). All direct proceeds from the federal carbon pollution pricing system are returned to the jurisdictions where they were collected, as required under the Greenhouse Gas Pollution Pricing Act.
Other revenues are made up of three broad components: net income from enterprise Crown corporations and other government business enterprises; other program revenues from the sales of goods and services, and other miscellaneous revenues; and foreign exchange revenues and return on investments. Other revenues accounted for 8.1% of total federal revenues in 2024 (up from 7.5% in 2023).
Composition of revenues for 2024
Note: Numbers may not add to 100% due to rounding.
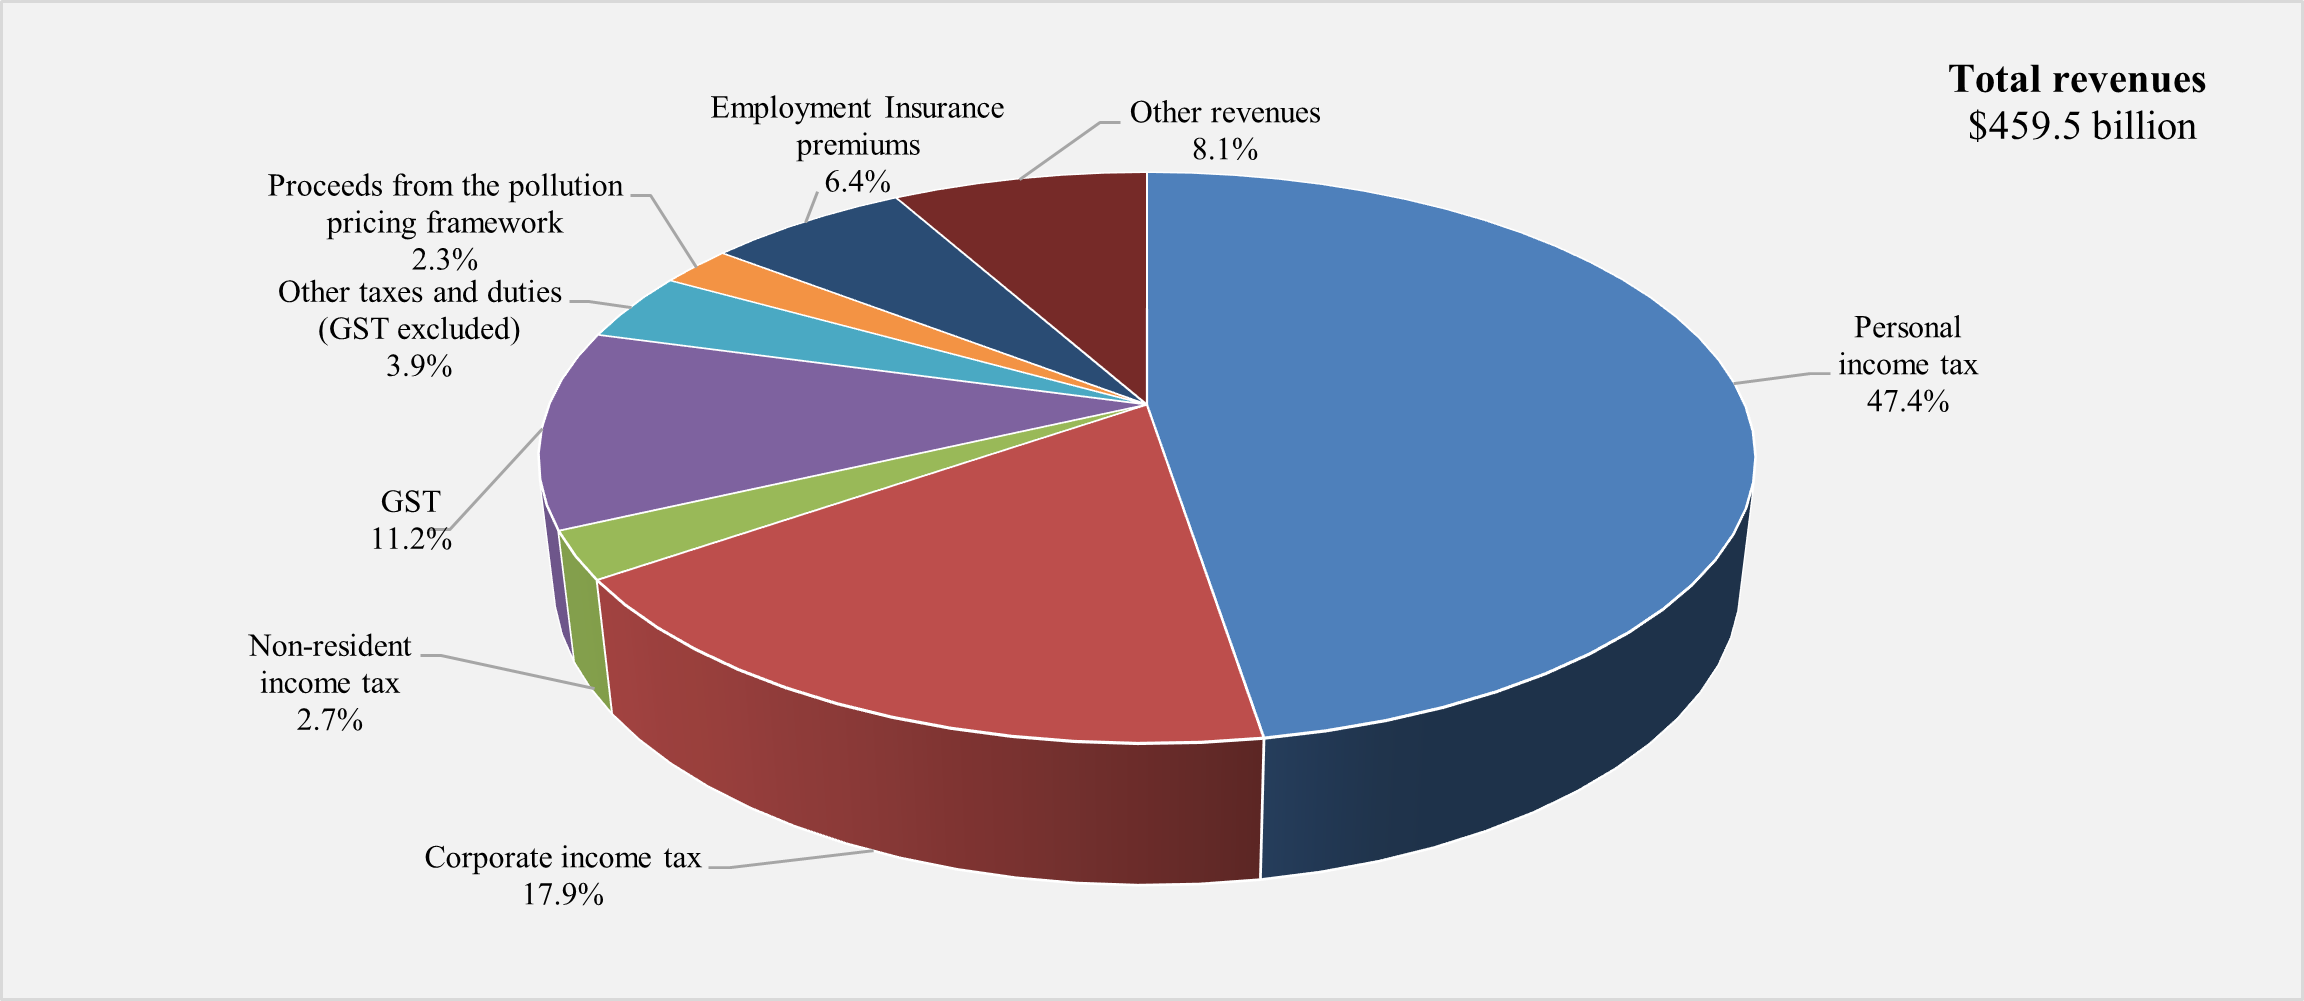
Image description
| Revenues | Percentage |
|---|---|
| Personal income tax | 47.4% |
| Corporate income tax | 17.9% |
| Non-resident income tax | 2.7% |
| GST | 11.2% |
| Other taxes and duties (GST excluded) | 3.9% |
| Proceeds from the pollution pricing framework | 2.3% |
| Employment Insurance premiums | 6.4% |
| Other revenues | 8.1% |
Pricing carbon pollution
The Greenhouse Gas Pollution Pricing Act establishes the framework for the federal carbon pollution pricing system. Since 2019, it is no longer free to pollute anywhere in Canada and provincial and territorial governments have been able to design and implement their own carbon pollution pricing systems to meet the minimum national stringency standards, or federal "benchmark". The federal pollution pricing system applies in jurisdictions that have requested it or decided not to implement a system that meets the benchmark.
The federal pricing system has two parts:
- a regulatory charge on fossil fuels like gasoline and natural gas, known as the fuel charge, and
- a performance-based system for industries, known as the Output-Based Pricing System.
One or both parts can apply in a jurisdiction.
The federal pollution pricing system is revenue neutral over time for the federal government. All the direct proceeds from the federal system are returned in the province or territory where they were collected.
The federal pollution pricing system helps make life affordable by returning money to families through the Canada Carbon Rebate (formerly known as the Climate Action Incentive payment) in provinces where the federal fuel charge applies—Alberta, Saskatchewan, Manitoba, Ontario, New Brunswick, Nova Scotia, Prince Edward Island, and Newfoundland and Labrador. Over 90% of fuel charge proceeds in these provinces are used to directly support families through the Canada Carbon Rebate, delivered quarterly by direct bank deposit or cheque. Eight out of ten households get more money back than they pay as a result of the federal carbon pollution pricing system, with lower-income households benefiting the most.
The remaining proceeds are returned to farmers, small- and medium-sized enterprises, and Indigenous governments through other federal mechanisms.
- Recognizing that many farmers use natural gas and propane in their operations, farmers in provinces where the federal fuel charge is in place can apply to receive a refundable tax credit.
- As announced in Budget 2024, the government will return proceeds directly to small- and medium-sized businesses in provinces where the federal fuel charge is in place through the Canada Carbon Rebate for Small Businesses, a new refundable tax credit.
- In recognition of the impacts of climate change on Indigenous communities, Environment and Climate Change Canada will return fuel charge proceeds to Indigenous governments through mechanisms co-developed with Indigenous partners. The government also announced that starting in fiscal year 2025, the share of fuel charge proceeds returned to Indigenous governments will increase from 1% to 2%.
In Yukon and Nunavut, proceeds from the federal fuel charge are returned directly to the territorial governments to use as they see fit.
Historical federal pollution pricing proceeds and pollution pricing proceeds returned can be found in the following table.
| Fiscal yearLinks to footnote 1 in table 5 | ||||||
|---|---|---|---|---|---|---|
| 2019 | 2020 | 2021 | 2022 | 2023 | 2024 | |
| Revenues | ||||||
| Pollution pricing proceeds to be returned to Canadians | ||||||
| Annual | – | 2.7 | 4.4 | 6.3 | 8.0 | 10.5 |
| Cumulative | – | 2.7 | 7.0 | 13.4 | 21.4 | 31.9 |
| Expenses | ||||||
| Pollution pricing proceeds returned to CanadiansLinks to footnote 2 in table 5 | ||||||
| Annual | 0.7 | 2.6 | 4.7 | 3.8 | 7.0 | 9.9 |
| Cumulative | 0.7 | 3.3 | 8.0 | 11.8 | 18.8 | 28.6 |
The difference between cumulative pollution pricing revenues (proceeds) and expenses (proceeds returned) is expected to largely unwind over the next two years, with the majority being returned through the Canada Carbon Rebate for Small Businesses in fiscal year 2025.
For more information on pollution pricing proceeds, please consult the Greenhouse Gas Pollution Pricing Act Annual Report to Parliament.
Revenues compared to 2023
Total revenues amounted to $459.5 billion in 2024, up $11.7 billion, or 2.6%, from 2023. The following table compares revenues for 2024 to 2023.
| 2024 | 2023 | Change | ||
|---|---|---|---|---|
| $ | % | |||
| Income tax revenues | ||||
| Personal | 217,696 | 207,872 | 9,824 | 4.7 |
| Corporate | 82,468 | 93,945 | (negative 11,477) | (negative 12.2) |
| Non-resident | 12,541 | 13,187 | (negative 646) | (negative 4.9) |
| Total | 312,705 | 315,004 | (negative 2,299) | (negative 0.7) |
| Other taxes and duties | ||||
| Goods and services tax | 51,416 | 45,962 | 5,454 | 11.9 |
| Energy taxes | 5,599 | 5,657 | (negative 58) | (negative 1.0) |
| Customs import duties | 5,571 | 6,057 | (negative 486) | (negative 8.0) |
| Other excise taxes and duties | 6,829 | 6,548 | 281 | 4.3 |
| Total | 69,415 | 64,224 | 5,191 | 8.1 |
| Employment insurance premiums | 29,560 | 26,914 | 2,646 | 9.8 |
| Pollution pricing proceeds | 10,503 | 8,041 | 2,462 | 30.6 |
| Other revenues | 37,366 | 33,632 | 3,734 | 11.1 |
| Total revenues | 459,549 | 447,815 | 11,734 | 2.6 |
- Personal income tax revenues increased by $9.8 billion in 2024, or 4.7%, driven by high employment and wage growth, reflecting continued strength in the labour market.
- Corporate income tax revenues decreased by $11.5 billion, or 12.2%, reflecting a decline in corporate profits in the non‑financial sector. The decline comes after significant increases in the preceding years, when corporate income tax revenues were supported by substantial gains in the resource and financial sectors.
- Non-resident income tax revenues are paid by non-residents on Canadian-sourced income. These revenues decreased by $0.6 billion, or 4.9%, reflecting lower dividends paid to non-residents.
- Other taxes and duties increased by $5.2 billion, or 8.1%, due mainly to growth in GST revenues, which increased by $5.5 billion in 2024, or 11.9%. The high year-over-year growth rate is attributable to the impact of the additional GST rebates paid in 2023, which reduced recorded revenues that year. Energy taxes fell by $0.1 billion, or 1.0%, reflecting lower motive fuel consumption. Customs import duties decreased by $0.5 billion, or 8.0%, reflecting lower imports. Other excise taxes and duties increased by $0.3 billion, or 4.3%, driven primarily by the luxury tax and excise duties on vaping products.
- EI premium revenues increased by $2.6 billion, or 9.8%, reflecting a higher premium rate and robust labour market conditions.
- Proceeds from the federal carbon pollution pricing framework increased by $2.5 billion, or 30.6%, reflecting a higher carbon pollution price of $65 per tonne in 2024 versus $50 per tonne in the year prior.
- Other revenues increased by $3.7 billion, or 11.1%, reflecting higher interest revenues and net foreign exchange revenues, partially offset by lower profits reported by enterprise Crown corporations.
The revenue ratio – revenues as a percentage of GDP – compares the total of all federal revenues to the size of the economy. This ratio is influenced by changes in statutory tax rates and by economic developments. The ratio stood at 15.7% in 2024 (unchanged from 2023).
Revenue ratio
(revenues as a percentage of GDP)
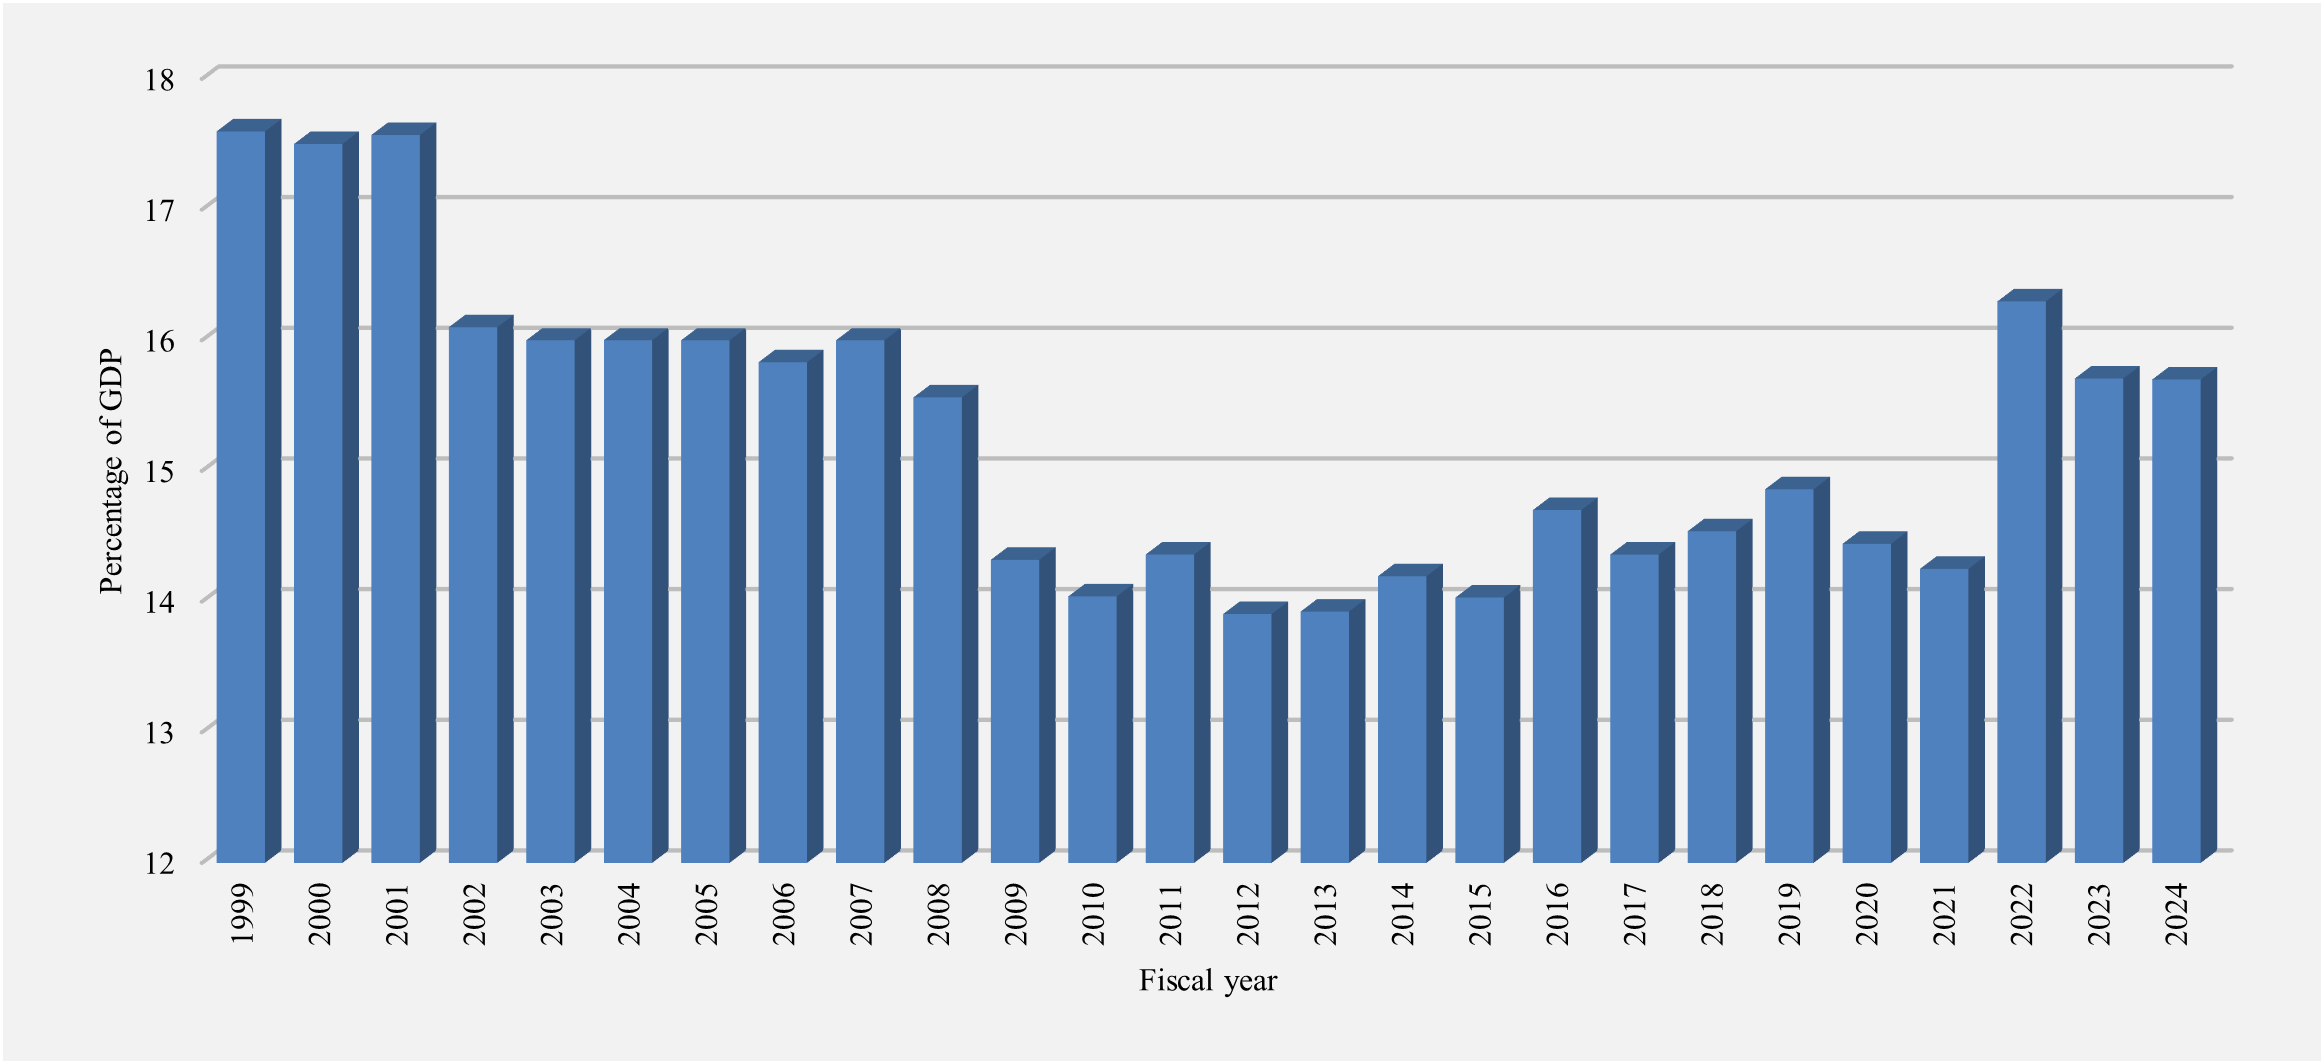
Image description
| Fiscal year | Percentage |
|---|---|
| 1999 | 17.6 |
| 2000 | 17.5 |
| 2001 | 17.6 |
| 2002 | 16.1 |
| 2003 | 16.0 |
| 2004 | 16.0 |
| 2005 | 16.0 |
| 2006 | 15.8 |
| 2007 | 16.0 |
| 2008 | 15.6 |
| 2009 | 14.3 |
| 2010 | 14.0 |
| 2011 | 14.4 |
| 2012 | 13.9 |
| 2013 | 13.9 |
| 2014 | 14.2 |
| 2015 | 14.0 |
| 2016 | 14.7 |
| 2017 | 14.4 |
| 2018 | 14.5 |
| 2019 | 14.9 |
| 2020 | 14.4 |
| 2021 | 14.3 |
| 2022 | 16.3 |
| 2023 | 15.7 |
| 2024 | 15.7 |
Expenses
Under the government's accrual accounting policies, expenses are recorded when they are incurred, rather than when the associated cash is paid. For certain types of expenses, this requires the use of estimation techniques and assumptions regarding future outcomes, such as the collection of loans and accounts receivable as reflected in provisions for credit risk, the cost of pension and other future benefits earned by employees during the fiscal year, and potential losses under litigation and other claims. Recorded amounts reflect the government's best estimates, based on circumstances and information available up to the point the financial statements are finalized.
Federal expenses can be broken down into four main categories: transfer payments, which account for the majority of all federal spending, other expenses, public debt charges, and net actuarial losses.
Transfer payments are classified under five categories:
- Major transfers to persons made up 23.1% of total expenses (down from 23.2% in 2023) and are statutory. This category consists of elderly benefits, EI benefits and support measures, children's benefits, and COVID-19 income support for workers (the Canada Emergency Response Benefit, the Canada Recovery Benefit, the Canada Recovery Sickness Benefit, the Canada Recovery Caregiving Benefit, and the Canada Worker Lockdown Benefit) introduced under Canada's COVID-19 Economic Response Plan. Of this, COVID-19 income support for workers accounted for a 0.9% decrease in total expenses in 2024 due to redeterminations of benefit overpayments, which are accounted for as a reduction in expenses (whereas it contributed a 0.7% reduction of total expenses in 2023).
- Major transfers to other levels of government—which include the Canada Health Transfer, the Canada Social Transfer, Canada-wide early learning and child care transfers, health agreements with provinces and territories, fiscal arrangements (Equalization, transfers to the territories, a number of smaller transfer programs and the Quebec Abatement), and the Canada Community-Building Fund transfers—made up 19.2% of total expenses in 2024 (up from 18.8% in 2023).
- Pollution pricing proceeds returned made up 1.9% of expenses (up from 1.4% in 2023). These transfers consist of payments that return direct proceeds from the federal carbon pollution pricing system to the jurisdictions where they were collected, as required under the Greenhouse Gas Pollution Pricing Act. For more information on the return of proceeds, please consult the Greenhouse Gas Pollution Pricing Act Annual Report to Parliament.
- The Canada Emergency Wage Subsidy (CEWS), which provided payments to eligible employers as part of the COVID-19 Economic Response Plan, ended in 2022. Redeterminations of previous claims reduced total expenses by 0.1% in 2024 (unchanged from a reduction of 0.1% in 2023).
- Other transfer payments, which include transfers to Indigenous Peoples, assistance to farmers, students and businesses, support for research and development, and international assistance, made up 18.5% of expenses (down from 20.5% in 2023).
Other expenses, which represent the operating expenses of the government's 135 departments, agencies, and consolidated Crown corporations and other entities, accounted for 26.9% of total expenses in 2024 (up from 26.8% in 2023).
Public debt charges made up 9.1% of total expenses in 2024 (up from 7.2% in 2023).
Net actuarial losses made up the remaining 1.4% of total expenses in 2024 (down from 2.0% in 2023).
Composition of expenses for 2024
Note: Numbers may not add to 100% due to rounding.
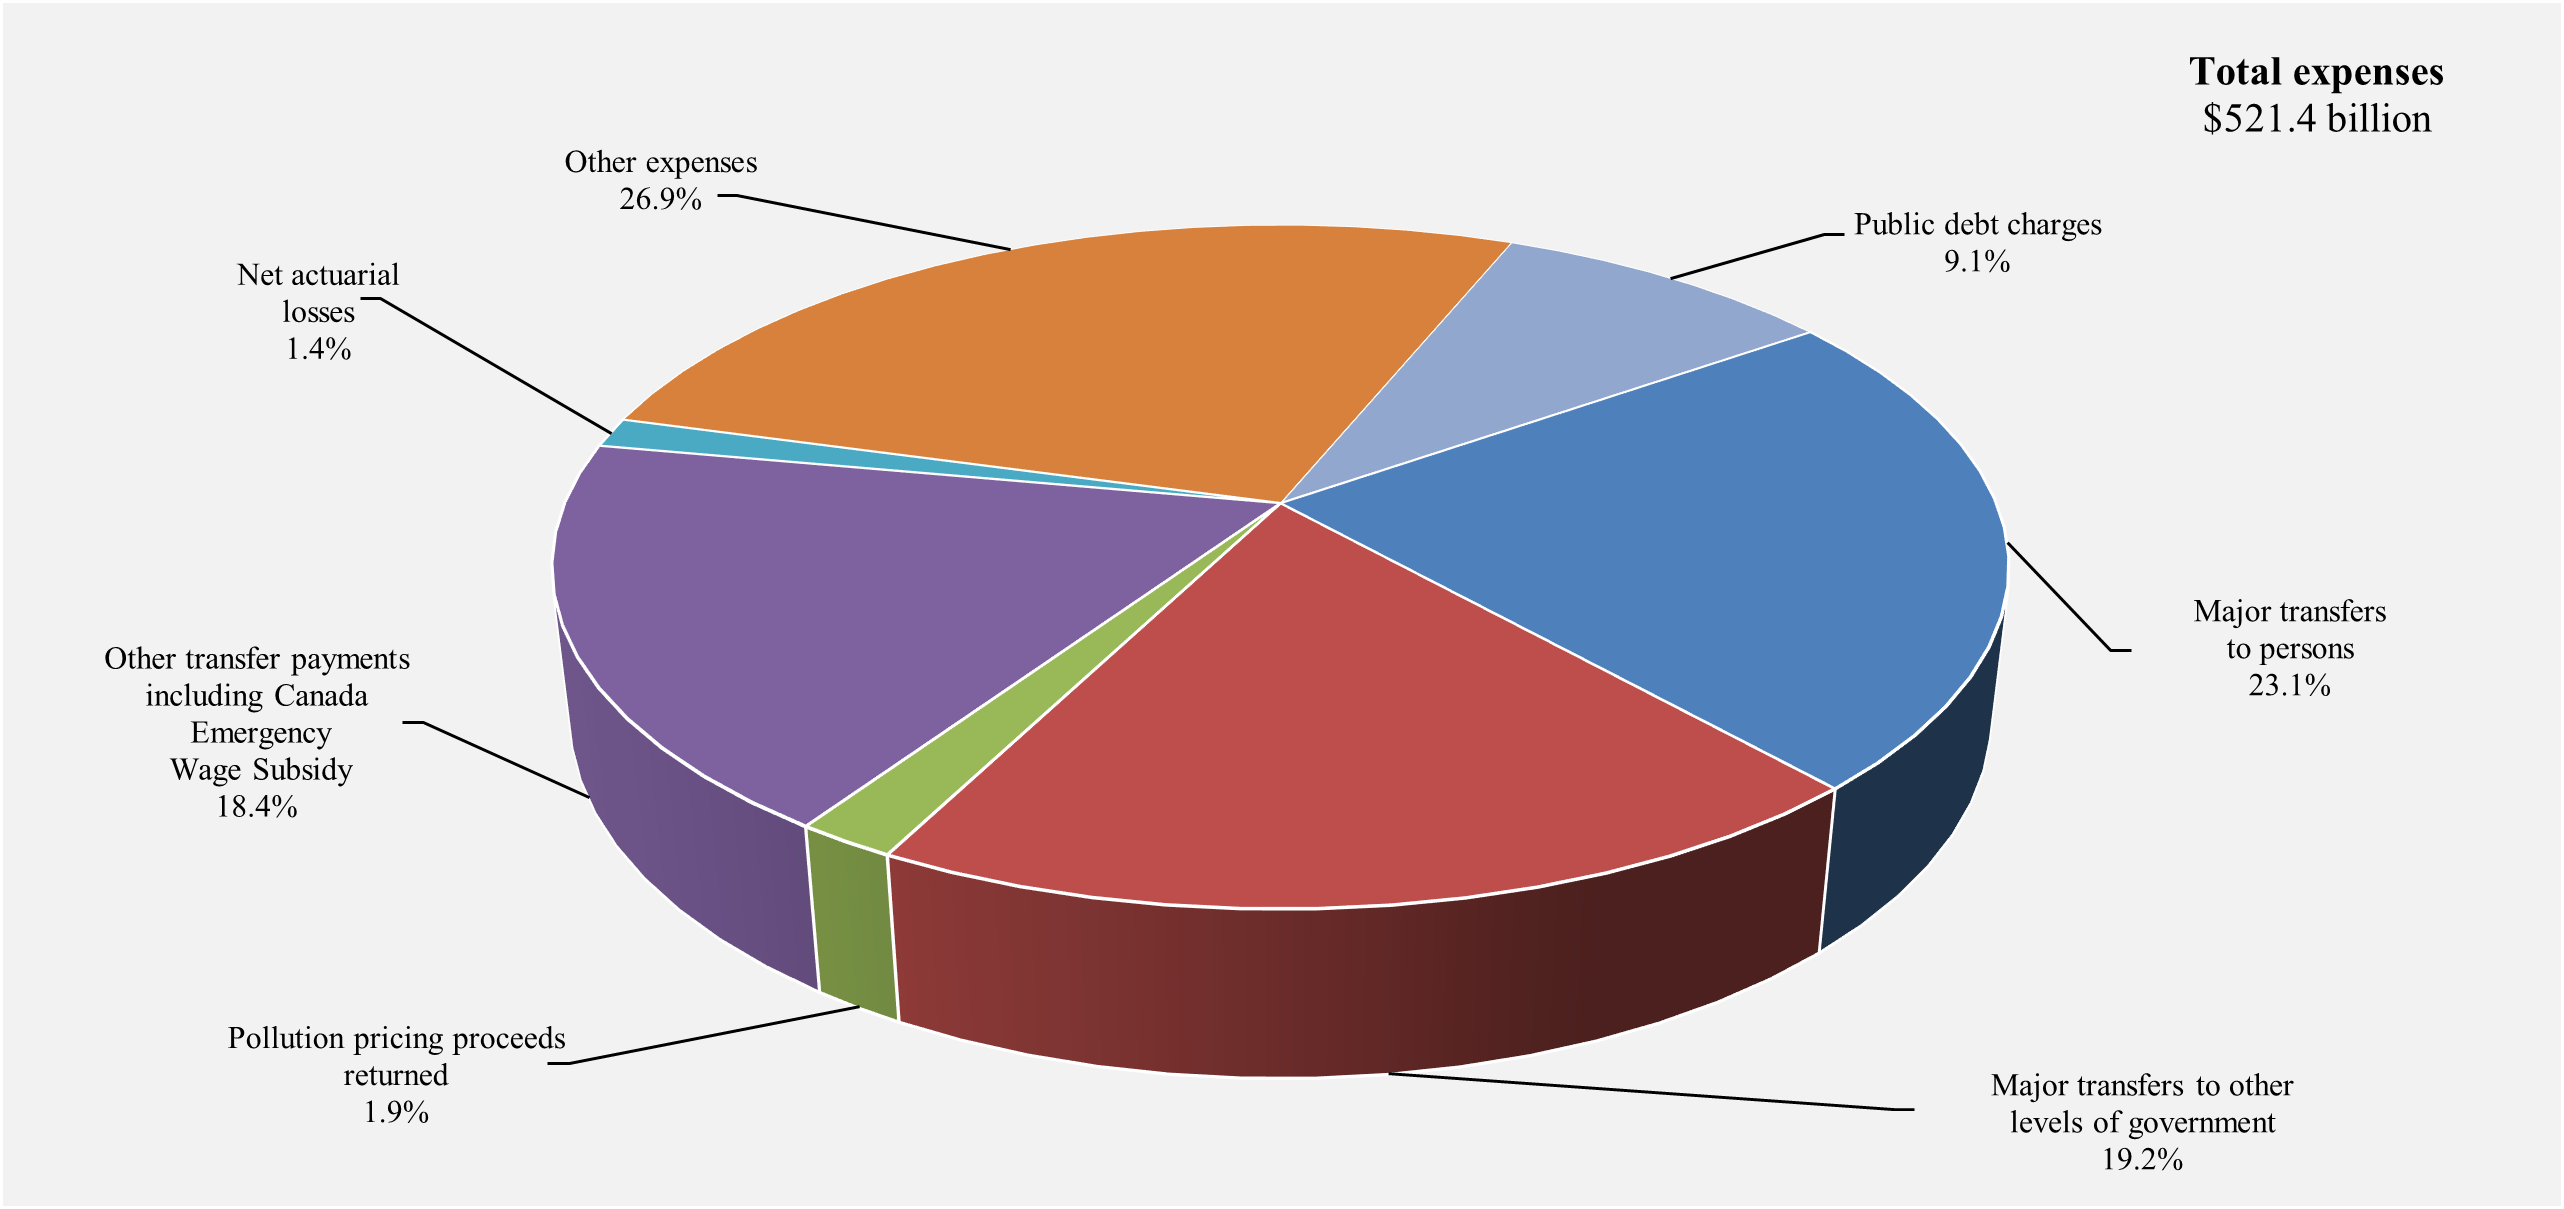
Image description
| Expenses | Percentage |
|---|---|
| Major transfers to persons, including COVID-19 income support for workers | 23.1% |
| Major transfers to other levels of government | 19.2% |
| Pollution pricing proceeds returned | 1.9% |
| Other transfer payments and Canada emergency wage subsidy | 18.4% |
| Net actuarial losses | 2.0% |
| Other expenses | 26.9% |
| Public debt charges | 9.1% |
Expenses compared to 2023
Total expenses amounted to $521.4 billion in 2024, up $38.3 billion, or 7.9%, from 2023. The following table compares total expenses for 2024 to 2023.
| 2024 | 2023 | Change | ||
|---|---|---|---|---|
| $ | % | |||
| Transfer payments | ||||
| Major transfers to persons | ||||
| Elderly benefits | 76,036 | 69,392 | 6,644 | 9.6 |
| Employment insurance and support measures | 23,130 | 21,836 | 1,294 | 5.9 |
| Children's benefits | 26,339 | 24,553 | 1,786 | 7.3 |
| COVID-19 income support for workers | (negative 4,838) | (negative 3,544) | (negative 1,294) | 36.5 |
| Total | 120,667 | 112,237 | 8,430 | 7.5 |
| Major transfers to other levels of government | ||||
| Federal transfer support for health and other social programs | 65,848 | 63,079 | 2,769 | 4.4 |
| Fiscal arrangements and other transfers | 34,325 | 27,705 | 6,620 | 23.9 |
| Total | 100,173 | 90,784 | 9,389 | 10.3 |
| Pollution pricing proceeds returned | 9,858 | 6,996 | 2,862 | 40.9 |
| Canada Emergency Wage Subsidy | (negative 420) | (negative 257) | (negative 163) | 63.4 |
| Other transfer payments | 96,371 | 99,199 | (negative 2,828) | (negative 2.9) |
| Total transfer payments | 326,649 | 308,959 | 17,690 | 5.7 |
| Other expenses, excluding net actuarial losses | 140,014 | 129,596 | 10,418 | 8.0 |
| Total program expenses, excluding net actuarial losses | 466,663 | 438,555 | 28,108 | 6.4 |
| Public debt charges | 47,273 | 34,955 | 12,318 | 35.2 |
| Total expenses, excluding net actuarial losses | 513,936 | 473,510 | 40,426 | 8.5 |
| Net actuarial losses | 7,489 | 9,627 | (negative 2,138) | (negative 22.2) |
| Total expenses | 521,425 | 483,137 | 38,288 | 7.9 |
- Major transfers to persons increased by $8.4 billion in 2024, largely reflecting an increase in elderly benefits.
Elderly benefits increased by $6.6 billion, or 9.6%, reflecting growth in the number of recipients and changes in consumer prices, to which benefits are fully indexed. In addition, as announced in Budget 2021 and implemented in July 2022, the Old Age Security pension has permanently increased by 10% for seniors aged 75 and over. EI benefits and support measures increased by $1.3 billion or 5.9%, largely reflecting a somewhat higher unemployment rate relative to the last two years. The increase in the unemployment rate is predominantly driven by stronger population growth. Children's benefits increased by $1.8 billion, or 7.3%, largely reflecting the indexation of benefits and a higher number of eligible children. COVID-19 income support for workers decreased by $1.3 billion, reflecting an increase in redeterminations of benefits. - Major transfers to other levels of government increased by $9.4 billion in 2024, primarily reflecting $5.2 billion in legislated growth under the Canada Health Transfer, the Canada Social Transfer, Equalization transfers, Territorial Formula Financing and the Canada Community-Building Fund, $2.5 billion for tailored bilateral health agreements announced in February 2023 and $0.6 billion previously announced for long-term care, and a $1.1-billion increase in Canada-wide early learning and child care transfers.
- Proceeds returned from the federal carbon pollution pricing framework increased by $2.9 billion, or 40.9%, reflecting an increase in the rate of the Canada Carbon Rebate (previously known as the Climate Action Incentive payment) and, starting July 2023, the inclusion of Newfoundland and Labrador, New Brunswick, Nova Scotia, and Prince Edward Island in the framework for the fuel charge.
- The CEWS decreased by $0.2 billion in 2024, reflecting an increase in redeterminations of previous claims in 2024.
- Other transfer payments decreased by $2.8 billion, or 2.9%, in 2024. This decrease was driven by lower international financial assistance, revised loan provisions, and lower claims expense. These decreases were partly offset by increased transfers in other areas, such as for housing initiatives, agricultural supports, refundable tax credits, and a concessionary discount on the value of Canada Student Loans recorded in 2024 to reflect the December 15, 2022, restructuring of loans to eliminate interest effective April 1, 2023.
- Other expenses of departments, agencies, and consolidated Crown corporations and other entities, excluding net actuarial losses, increased by $10.4 billion, or 8.0%, largely reflecting increases in personnel costs and bad debt expense on taxes receivable and receivables resulting from redeterminations of benefits delivered during the COVID-19 pandemic.
- Public debt charges increased by $12.3 billion, or 35.2%, largely reflecting an increase in the average effective interest rate on interest-bearing debt, offset in part by lower Consumer Price Index adjustments on Real Return Bonds.
- Net actuarial losses, which reflect changes in the value of the government's obligations and assets for public sector pensions and other employee and veteran future benefits recorded in previous fiscal years, decreased $2.1 billion, or 22.2%, largely reflecting the amortization of actuarial gains due to higher discount rates arising from actuarial valuations prepared for the Public Accounts of Canada 2023.
The expense ratio—expenses as a percentage of GDP—compares the total of all federal expenses to the size of the economy. This ratio is influenced by policy actions, economic developments, and changes in interest rates. The ratio stood at 17.8% in 2024 (up from 16.9% in 2023), largely reflecting legislated growth in transfers and increased investment in priority areas such as health care, and higher interest rates.
Expense ratio
(expenses as a percentage of GDP)
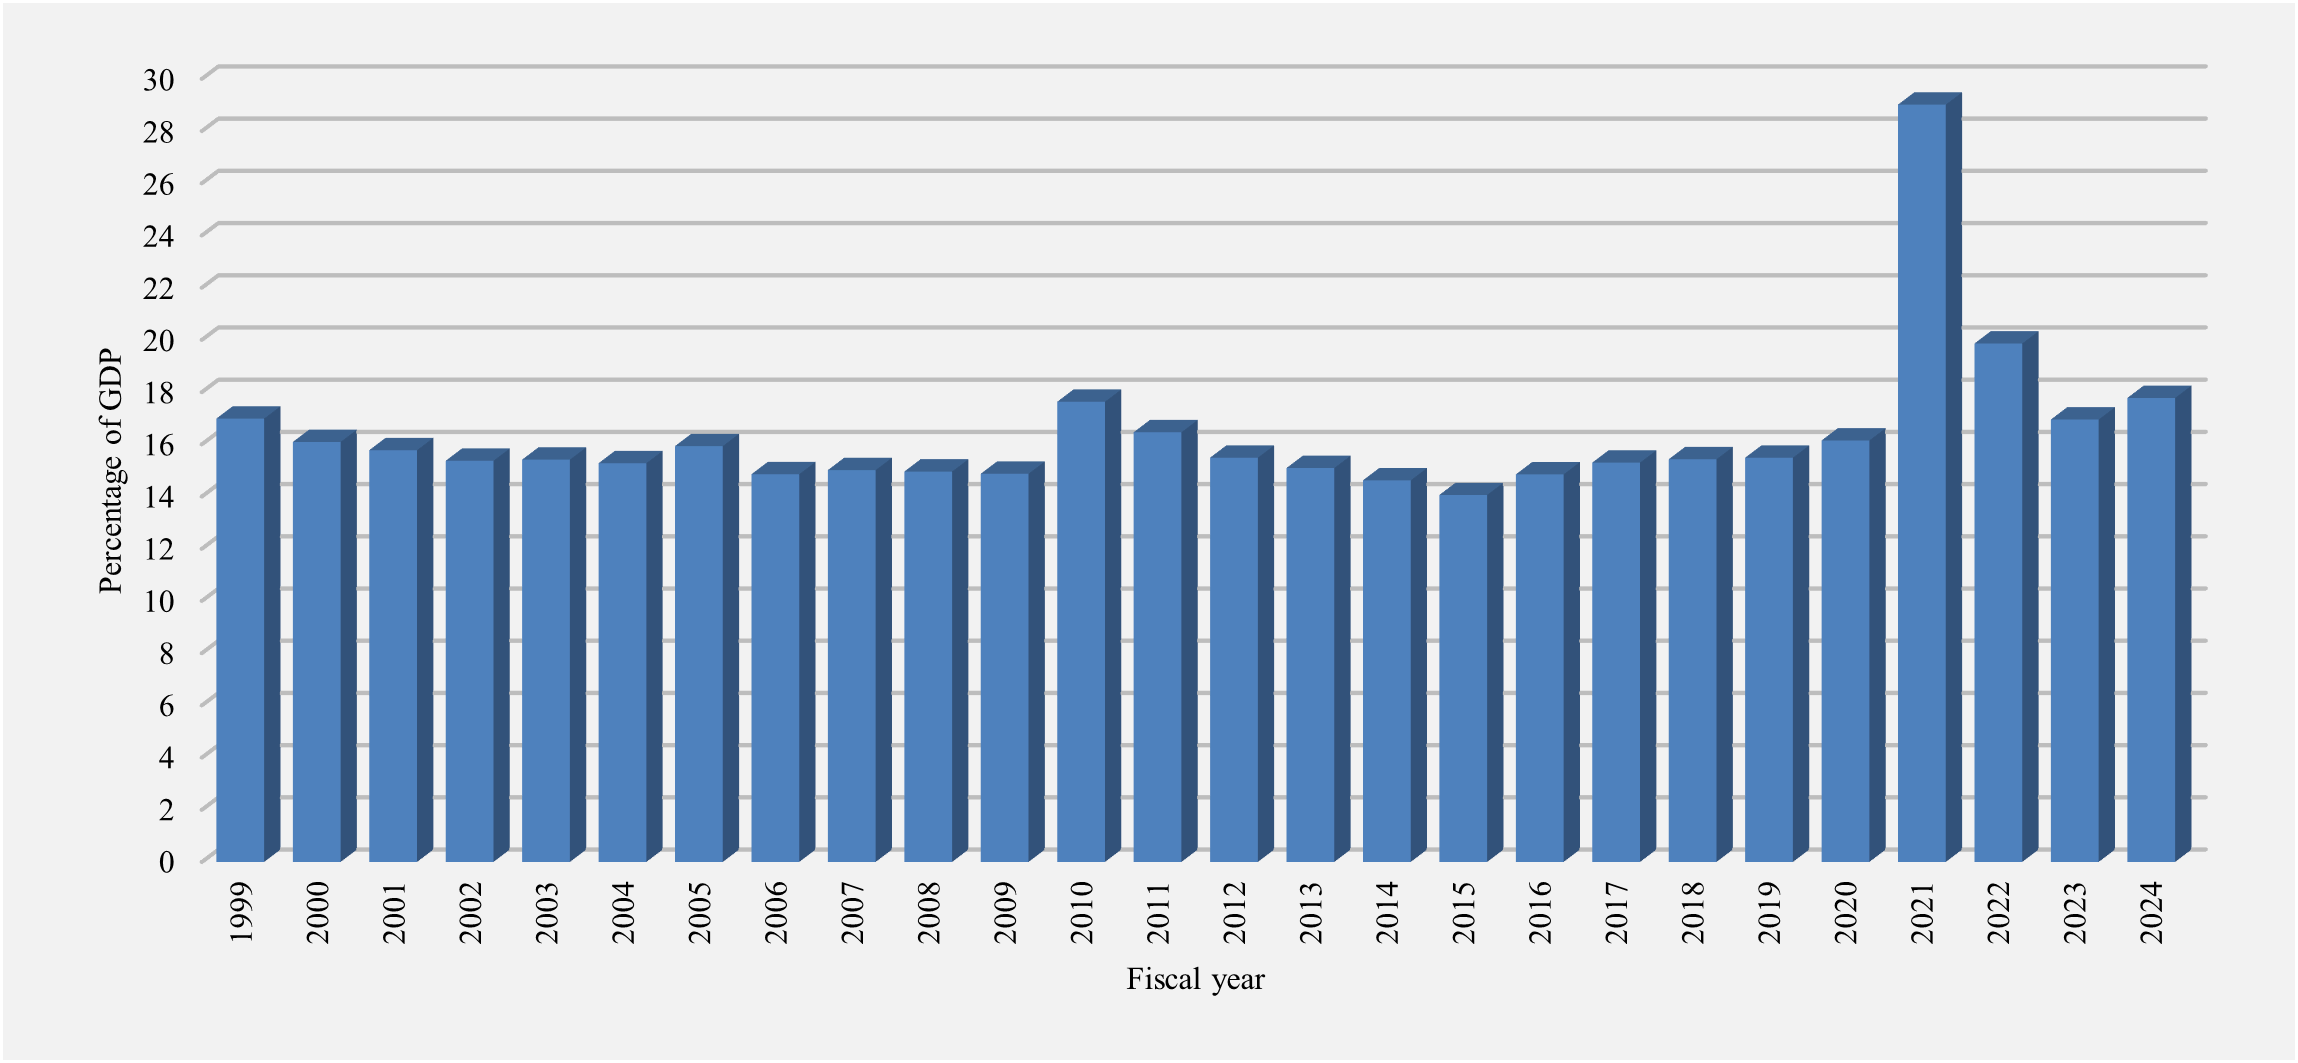
Image description
| Fiscal year | Program expenses | Public debt charges |
|---|---|---|
| 1999 | 12.4 | 4.6 |
| 2000 | 11.8 | 4.3 |
| 2001 | 11.8 | 4.0 |
| 2002 | 11.9 | 3.5 |
| 2003 | 12.3 | 3.1 |
| 2004 | 12.4 | 2.9 |
| 2005 | 13.4 | 2.6 |
| 2006 | 12.5 | 2.4 |
| 2007 | 12.7 | 2.3 |
| 2008 | 12.8 | 2.1 |
| 2009 | 13.2 | 1.7 |
| 2010 | 15.9 | 1.7 |
| 2011 | 14.7 | 1.7 |
| 2012 | 13.8 | 1.6 |
| 2013 | 13.7 | 1.4 |
| 2014 | 13.3 | 1.3 |
| 2015 | 12.8 | 1.2 |
| 2016 | 13.7 | 1.1 |
| 2017 | 14.2 | 1.0 |
| 2018 | 14.4 | 1.0 |
| 2019 | 14.4 | 1.0 |
| 2020 | 15.1 | 1.1 |
| 2021 | 28.1 | 0.9 |
| 2022 | 18.9 | 1.0 |
| 2023 | 15.7 | 1.2 |
| 2024 | 16.2 | 1.6 |
Comparison of actual results to budget projections
Comparison to April 2024 budget plan
The $61.9-billion deficit recorded in 2024 was $21.8 billion higher than the $40.0-billion deficit projected in the April 2024 federal budget.
- Overall, revenues were $5.5 billion, or 1.2%, lower than forecast. This variance from forecast was due mainly to lower tax revenues, particularly lower personal income tax revenues than projected, reflecting prior year reassessments that were determined and recorded in the current year. Generally, these reassessments are idiosyncratic in their timing, although they are often determined towards the end of the fiscal year and recorded as part of year-end adjustments, making them difficult to predict. In addition, after posting double-digit increases in each of the past two years, lower corporate profitability led to a decline in corporate income tax revenues, resulting in lower overall tax revenues than anticipated.
- Program expenses, excluding net actuarial losses, were $16.4 billion, or 3.6%, higher than projected, largely a result of higher-than-anticipated provisions for Indigenous claims, reflecting the government's emphasis on reconciliation, and revised allowances for doubtful accounts for receivables and loans, including those related to redeterminations of benefits delivered during the COVID-19 pandemic and CEBA loans, and a concession related to the interest-free nature of federal student loans. Such valuations typically occur after the end of the fiscal year, and often incorporate information available subsequent to March 31.
- Public debt charges were in line with projections.
- Net actuarial losses were $0.1 billion lower than projected.
| Projection | Actual | Difference | |
|---|---|---|---|
| Revenues | 465,055 | 459,549 | (negative 5,506) |
| Expenses | |||
| Program expenses, excluding net actuarial losses | 450,292 | 466,663 | 16,371 |
| Public debt charges | 47,234 | 47,273 | 39 |
| Total expenses, excluding net actuarial losses | 497,526 | 513,936 | 16,410 |
| Annual operating deficit before net actuarial losses | (negative 32,471) | (negative 54,387) | (negative 21,916) |
| Net actuarial losses | (negative 7,556) | (negative 7,489) | 67 |
| Annual operating deficit | (negative 40,027) | (negative 61,876) | (negative 21,849) |
Comparison to March 2023 budget plan
The 2024 budgetary deficit of $61.9 billion was $21.8 billion higher than the $40.1-billion deficit projected for 2024 in the March 2023 federal budget.
Revenues were $2.8 billion, or 0.6%, higher than forecast in the March 2023 budget, driven by higher other revenues and EI premium revenues.
Total expenses, excluding net actuarial losses, were $23.4 billion, or 4.8%, higher than projected in the March 2023 budget, with program expenses $20.1 billion higher than forecast and public debt charges $3.4 billion higher than forecast.
- Major transfers to persons were $5.1 billion lower than forecast, largely attributable to the redetermination of benefits of COVID-19 income support for workers and lower EI benefits resulting from lower realized unemployment figures than projected.
- Major transfers to other levels of government were slightly higher than projected, primarily due to lower recoveries under the Quebec Abatement.
- Pollution pricing proceeds returned were $1.3 billion lower than projected, primarily due to revised timing of returning pollution pricing fuel charge proceeds to small- and medium-sized businesses and Indigenous groups.
- Direct program expenses, which comprise the CEWS, other transfer payments, and other operating and capital amortization expenses, were $26.4 billion higher than projected in the March 2023 budget. The variance from forecast is largely a result of developments after the budget, including higher-than-anticipated expenses related to Indigenous claims and revised allowances for accounts receivable and loans, including COVID-19 benefit overpayments receivable and CEBA loans, as well as a concession related to the interest-free nature of federal student loans.
- Public debt charges were $3.4 billion higher than expected in the March 2023 budget, largely reflecting higher-than-forecast interest rates on government bonds and treasury bills and higher Consumer Price Index adjustments on Real Return Bonds, partially offset by lower-than-forecast interest on the government's pensions and other future benefits.
- Net actuarial losses were $1.1 billion higher than projected, reflecting lower-than-forecast gains resulting from actuarial valuations prepared for the Public Accounts of Canada 2023, which were amortized starting in 2024.
| ProjectionLinks to footnote 1 in table 12 | Actual | Difference | |
|---|---|---|---|
| Revenues | |||
| Income tax revenues | 312,944 | 312,705 | (negative 239) |
| Other taxes and duties | 70,796 | 69,415 | (negative 1,381) |
| Employment insurance premiums | 28,218 | 29,560 | 1,342 |
| Pollution pricing proceeds | 10,127 | 10,503 | 376 |
| Other revenues | 34,692 | 37,366 | 2,674 |
| Total revenues | 456,777 | 459,549 | 2,772 |
| Expenses | |||
| Program expenses | |||
| Major transfers to persons | 125,742 | 120,667 | (negative 5,075) |
| Major transfers to other levels of government | 100,119 | 100,173 | 54 |
| Pollution pricing proceeds returned | 11,174 | 9,858 | (negative 1,316) |
| Direct program expenses | |||
| Canada Emergency Wage Subsidy | – | (negative 420) | (negative 420) |
| Other transfer payments | 85,846 | 96,371 | 10,525 |
| Other expenses, excluding net actuarial losses | 123,732 | 140,014 | 16,282 |
| Total program expenses, excluding net actuarial losses | 446,613 | 466,663 | 20,050 |
| Public debt charges | 43,881 | 47,273 | 3,392 |
| Total expenses, excluding net actuarial losses | 490,494 | 513,936 | 23,442 |
| Annual operating deficit before net actuarial losses | (negative 33,717) | (negative 54,387) | (negative 20,670) |
| Net actuarial losses | (negative 6,383) | (negative 7,489) | (negative 1,106) |
| Annual operating deficit | (negative 40,100) | (negative 61,876) | (negative 21,776) |
Accumulated deficit
The accumulated deficit is the difference between the government's total liabilities and total assets. It consists of the accumulated operating deficit and accumulated remeasurement gains and losses.
Remeasurement gains and losses represent unrealized gains and losses due to changes in the fair value of derivatives and certain other financial instruments held by the government, excluding gains and losses due to changes in foreign exchange rates, which are charged directly to the budgetary balance. Fair values of derivatives reported in the government's financial statements represent estimated amounts the government would have to receive or pay, based on market factors, if the agreements were terminated on March 31. The government uses derivatives, such as swap agreements and foreign exchange forward agreements, to manage financial risks and as a general practice holds these agreements to maturity.
Net remeasurement gains and losses also include other comprehensive income or loss reported by enterprise Crown corporations and other government business enterprises. Other comprehensive income or loss consists of certain unrealized gains and losses on Crown corporations' financial instruments and actuarial gains and losses related to their pensions and other employee future benefit plans.
The government began reporting remeasurement gains and losses in 2023 with the adoption of a new suite of financial instruments standards issued by the Public Sector Accounting Board. In accordance with those standards, remeasurement gains and losses are not included in the government's annual budgetary balance and are instead recorded directly as part of the accumulated deficit.
| 2024 | 2023 | Difference | |
|---|---|---|---|
| Accumulated deficit at beginning of year | (negative 1,173,013) | (negative 1,142,538) | (negative 30,475) |
| Annual operating deficit | (negative 61,876) | (negative 35,322) | (negative 26,554) |
| Net remeasurement (losses) gains for the year | (negative 1,262) | 4,847 | (negative 6,109) |
| Accumulated deficit at end of year | (negative 1,236,151) | (negative 1,173,013) | (negative 63,138) |
| Accumulated deficit is comprised of: | |||
| Accumulated operating deficit | (negative 1,245,494) | (negative 1,183,618) | (negative 61,876) |
| Accumulated remeasurement gains | 9,343 | 10,605 | (negative 1,262) |
| Total | (negative 1,236,151) | (negative 1,173,013) | (negative 63,138) |
The accumulated deficit increased by $63.1 billion in 2024, reflecting the $61.9-billion budgetary deficit and $1.3 billion in net remeasurement losses. As a percentage of GDP, the accumulated deficit increased 1.0 percentage point to 42.1% of GDP at March 31, 2024. The government is committed to reducing the accumulated deficit-to-GDP ratio over the medium term as its key fiscal anchor.
Graph - Accumulated deficit
(as a percentage of GDP)
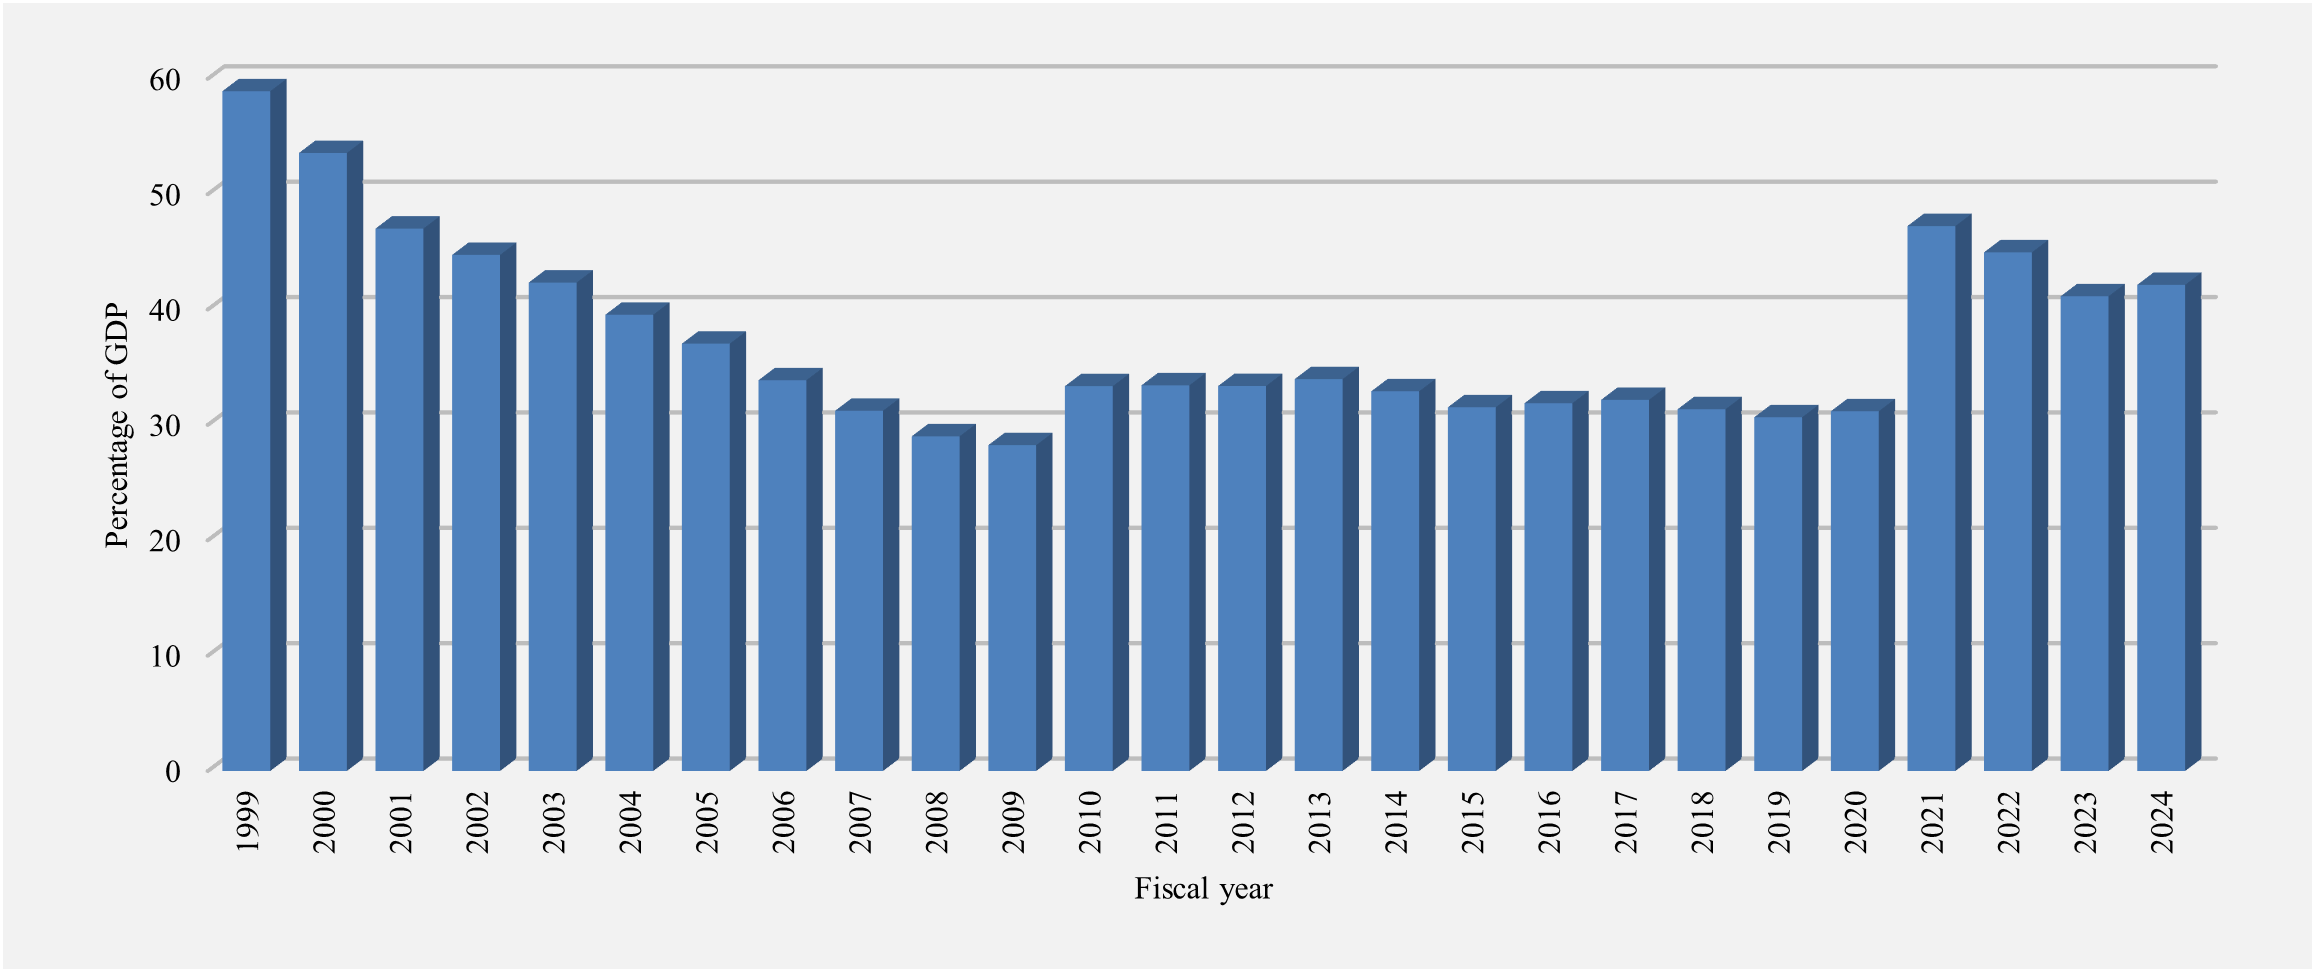
Image description
| Fiscal year | Percentage |
|---|---|
| 1999 | 58.9 |
| 2000 | 53.6 |
| 2001 | 47.0 |
| 2002 | 44.7 |
| 2003 | 42.3 |
| 2004 | 39.5 |
| 2005 | 37.0 |
| 2006 | 33.9 |
| 2007 | 31.2 |
| 2008 | 29.0 |
| 2009 | 28.2 |
| 2010 | 33.4 |
| 2011 | 33.4 |
| 2012 | 33.4 |
| 2013 | 34.0 |
| 2014 | 32.9 |
| 2015 | 31.5 |
| 2016 | 31.9 |
| 2017 | 32.2 |
| 2018 | 31.4 |
| 2019 | 30.7 |
| 2020 | 31.2 |
| 2021 | 47.2 |
| 2022 | 45.0 |
| 2023 | 41.1 |
| 2024 | 42.1 |
Measures of government debt
There are several generally accepted measures of government debt.
- Total liabilities of the government consist of unmatured debt (i.e., debt issued on the credit markets), pension and other future benefit liabilities, other interest-bearing liabilities, accounts payable and accrued liabilities, foreign exchange accounts liabilities, and derivative liabilities.
- Net debt is equal to the total liabilities of the government less its financial assets. Financial assets include cash and cash equivalents, accounts receivable, foreign exchange accounts assets, derivative assets, loans, investments and advances, and public sector pension assets.
- The accumulated deficit is equal to total liabilities less total assets—both financial and non-financial. Non-financial assets include primarily tangible capital assets, such as land and buildings, as well as inventories, and prepaid expenses. The accumulated deficit is the federal government's main measure of debt.
Measures of Government debt chart
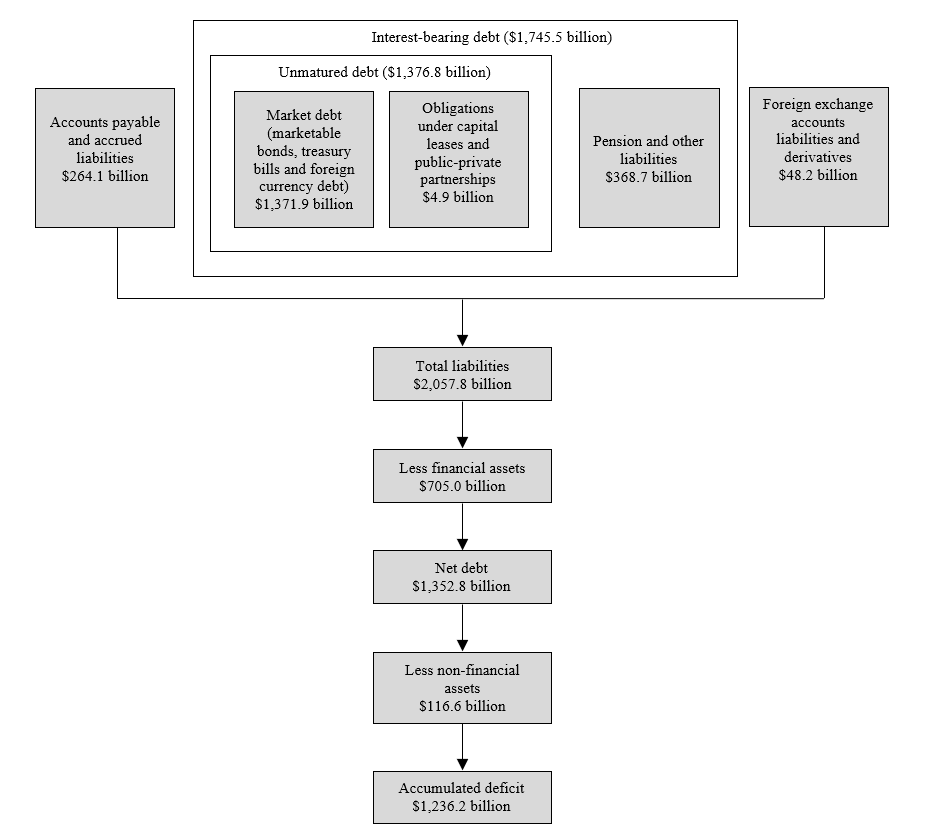
Image description
The Measures of Government debt chart a total of 10 relationship boxes. The first 5 liability measurements align horizontally as follows: Unmatured debt which is made up of Market debt for $1,371.9 billion (marketable bonds, treasury bills, retail debt and foreign currency debt) and Obligations under capital leases and public-private partnerships for $4.9 billion; Pension and other liabilities for $368.7 billion; Accounts payable and accrued liabilities for $264.1 billion; and Foreign exchange accounts liabilities and derivatives for $48.2 billion. The remaining measurement relationship boxes are aligned vertically below as follows: Total liabilities for $2,057.8 billion; Less financial assets for $705.0 billion; Net debt for $1,352.8 billion; Less non-financial assets for $116.6 billion; and Accumulated deficit for $1,236.2 billion.
The following sections provide more details on each of these components.
| 2024 | 2023 | Difference | |
|---|---|---|---|
| Liabilities | |||
| Accounts payable and accrued liabilities | 264,056 | 259,440 | 4,616 |
| Interest-bearing debt | |||
| Unmatured debt | 1,376,822 | 1,265,040 | 111,782 |
| Pensions and other future benefits | 361,704 | 344,374 | 17,330 |
| Other liabilities | 6,963 | 7,339 | (negative 376) |
| Total | 1,745,489 | 1,616,753 | 128,736 |
| Foreign exchange accounts liabilities | 44,106 | 44,151 | (negative 45) |
| Derivatives | 4,131 | 4,689 | (negative 558) |
| Total liabilities | 2,057,782 | 1,925,033 | 132,749 |
| Financial assets | |||
| Cash and accounts receivable | 292,103 | 243,520 | 48,583 |
| Foreign exchange accounts assets | 180,140 | 169,390 | 10,750 |
| Derivatives | 2,928 | 3,260 | (negative 332) |
| Loans, investments and advances | 209,802 | 213,110 | (negative 3,308) |
| Public sector pension assets | 20,055 | 12,996 | 7,059 |
| Total financial assets | 705,028 | 642,276 | 62,752 |
| Net debt | (negative 1,352,754) | (negative 1,282,757) | (negative 69,997) |
| Non-financial assets | 116,603 | 109,744 | 6,859 |
| Accumulated deficit | (negative 1,236,151) | (negative 1,173,013) | (negative 63,138) |
Accounts payable and accrued liabilities
The government's accounts payable and accrued liabilities consist of amounts payable related to tax based on assessments and estimates of refunds owing for tax assessments not completed by year-end; provisions for contingent liabilities, including for guarantees provided by the government and claims and pending and threatened litigation; environmental liabilities and asset retirement obligations, which include estimated costs related to the remediation of contaminated sites and the future retirement of certain tangible capital assets; deferred revenue; and other accounts payable and accrued liabilities. Other accounts payable and accrued liabilities include items such as accrued salaries and benefits; amounts payable to provinces, territories and Indigenous governments for taxes collected and administered on their behalf in accordance with tax agreements; and amounts owing at year-end pursuant to contractual arrangements or for work performed or goods received.
Accounts payable and accrued liabilities by category for 2024
Note: Numbers may not add to 100% due to rounding.
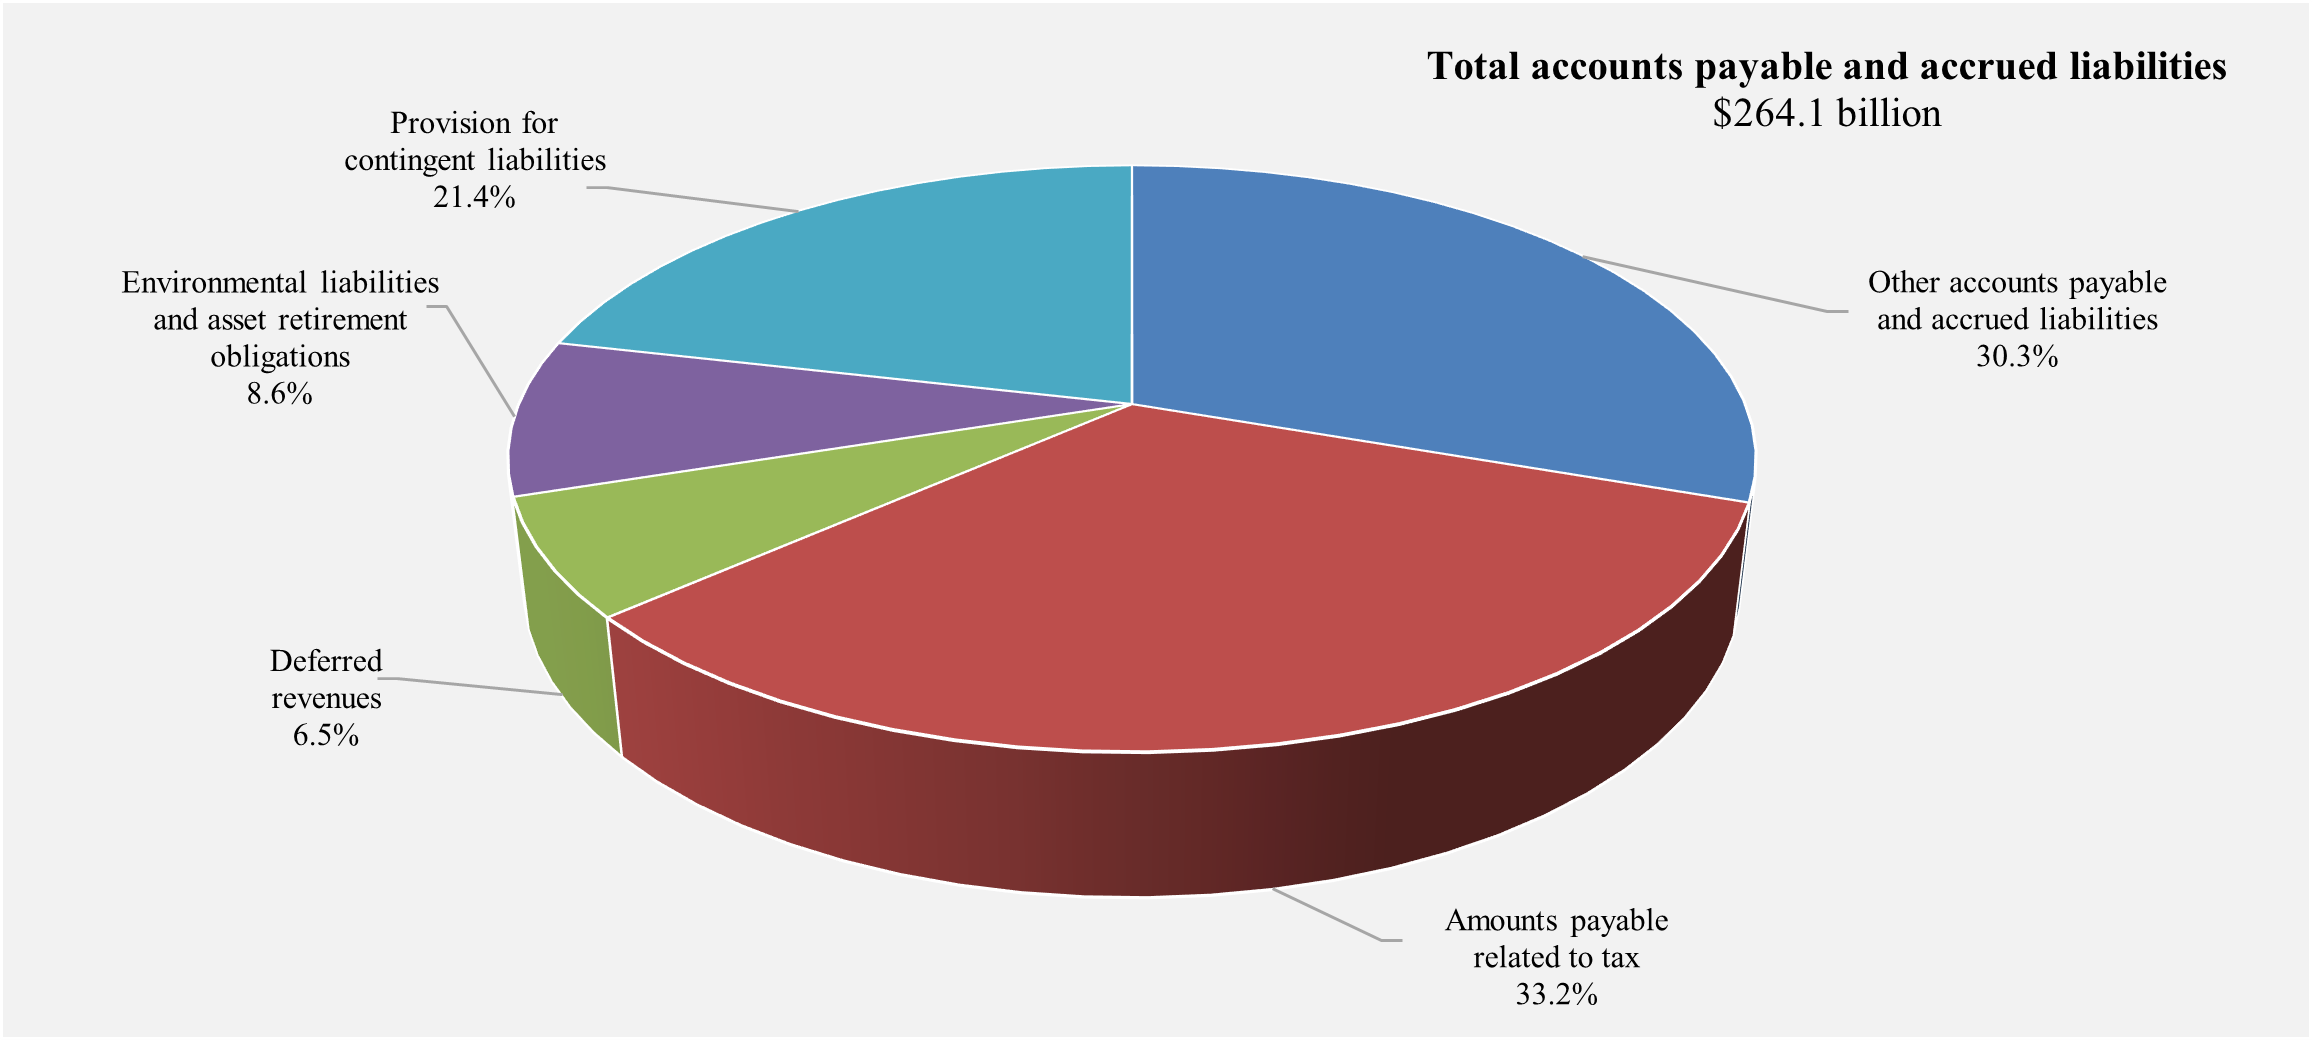
Image description
| Accounts payable and accrued liabilities | Percentage |
|---|---|
| Other accounts payable and accrued liabilities | 30.3% |
| Amounts payable related to tax | 33.2% |
| Deferred revenues | 6.5% |
| Environmental liabilities and asset retirement obligations | 8.6% |
| Provision for contingent liabilities | 21.4% |
At March 31, 2024, accounts payable and accrued liabilities totalled $264.1 billion, up $4.6 billion from March 31, 2023. This increase reflects significant growth in other accounts payable and accrued liabilities and a modest increase in amounts payable related to tax, offset in part by a large decline in contingent liabilities and smaller decreases in deferred revenue and environmental liabilities and asset retirement obligations.
- Amounts payable related to tax increased by $3.0 billion in 2024, from $84.7 billion at March 31, 2023, to $87.7 billion at March 31, 2024. This increase largely reflects higher accrued payables related to individual and corporate income tax, offset in part by a decrease in amounts payable related to the GST/Harmonized Sales Tax, in large part due to the payment in 2024 of the Grocery Rebate accrued in the previous fiscal year.
- Provisions for contingent liabilities decreased by $19.4 billion, as increases in liabilities for new claims and reassessments of existing claims were more than offset by payments made during the year, including $2.8 billion to settle the Gottfriedson Band class litigation, $5.0 billion to settle past claims under the Robinson-Huron Treaty, and a $23.3-billion payment in February 2024 under the final settlement agreement for First Nations Child and Family Services.
- Environmental liabilities and asset retirement obligations decreased by $0.5 billion in 2024, largely reflecting the settlement of obligations and remediation activities undertaken in 2024, offset in part by increases in amounts accrued due to accretion expense and revisions in estimates.
- Deferred revenue decreased by $0.6 billion in 2024, largely reflecting the amortization of proceeds from prior years' spectrum auctions in revenues, offset in part by the addition of proceeds received from the auction of spectrum licenses in the 3800 MHz band in 2024.
- Other accounts payable and accrued liabilities increased by $22.1 billion in 2024. Within this component, liabilities under provincial, territorial and Indigenous tax agreements increased by $11.3 billion, largely reflecting the difference between estimated corporate income tax owing to provinces and territories and actual payments made to provinces and territories to date. Accounts payable increased by $11.6 billion due to a number of factors including an increase in the amount payable to the Canada Pension Plan (CPP) at year end for CPP contributions collected by the government; liabilities under transfer payment programs, including disaster assistance, the Dairy Direct Payment Program, and $2.5 billion in funding under the new tailored bilateral health agreements with provinces and territories; as well as amounts owing at year-end for goods and services received. These increases were offset in part by a $0.9-billion decrease in accrued salaries and benefits, reflecting the payment of retroactive salaries under signed collective agreements in 2024.
Accounts payable and accrued liabilities have increased significantly in recent years, from $123.4 billion at March 31, 2017, to $264.1 billion at March 31, 2024. This increase is due in large part to an increase in accounts payable pursuant to contractual agreements, for work performed, goods received, and services rendered; increased provisions for contingent liabilities, reflecting the government's efforts to accelerate the resolution of Indigenous claims to support reconciliation in Canada; and growth in amounts payable related to tax, reflecting growth in the tax base.
Graph - Accounts payable and accrued liabilities
Note 1: Other includes provisions for environmental liabilities and asset retirement obligations and deferred revenues.
(in billions of dollars)
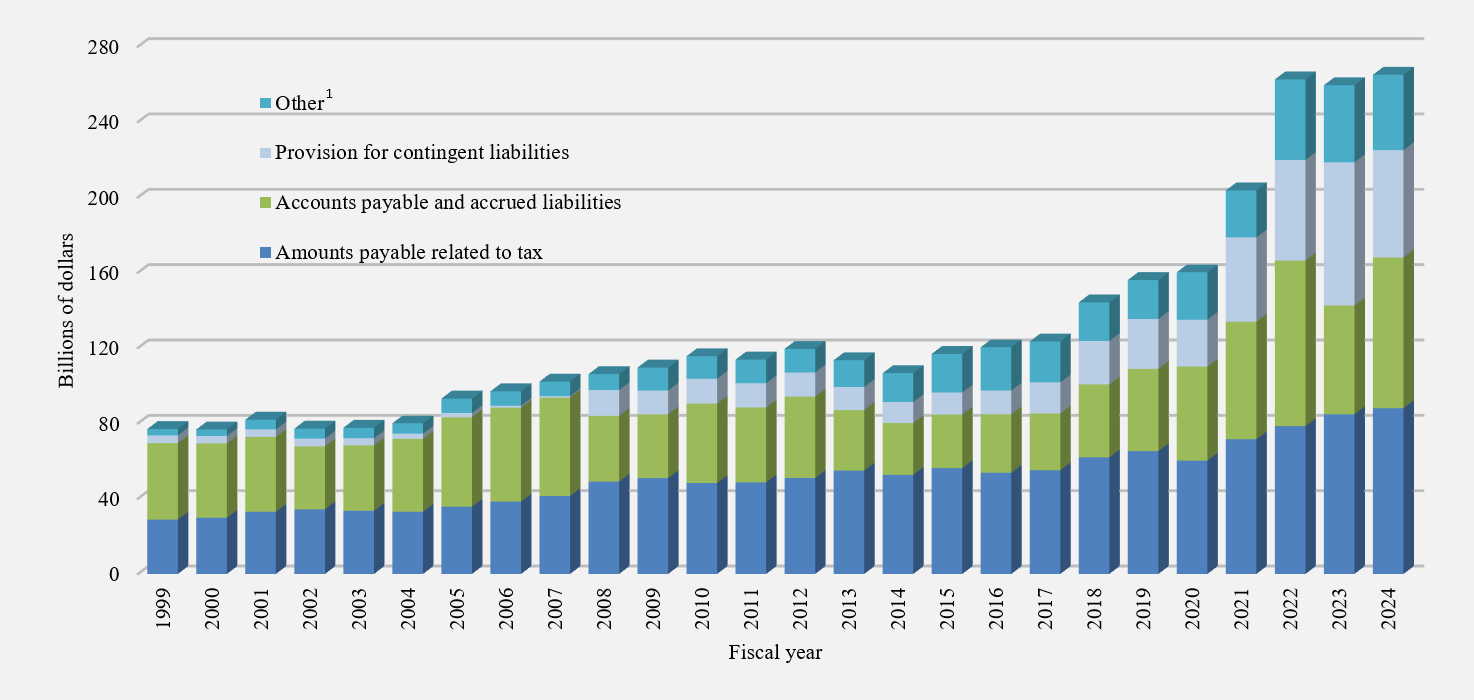
Image description
| Fiscal year | Amounts payable related to tax | Accounts payable and accrued liabilities | Provision for contingent liabilities | OtherLinks to footnote 1 in table 17 |
|---|---|---|---|---|
| 1999 | 29 | 41 | 4 | 3 |
| 2000 | 30 | 40 | 4 | 3 |
| 2001 | 33 | 40 | 4 | 5 |
| 2002 | 34 | 33 | 4 | 5 |
| 2003 | 34 | 35 | 4 | 6 |
| 2004 | 33 | 39 | 3 | 5 |
| 2005 | 36 | 48 | 2 | 8 |
| 2006 | 38 | 50 | 1 | 8 |
| 2007 | 41 | 52 | 1 | 8 |
| 2008 | 49 | 35 | 14 | 8 |
| 2009 | 51 | 34 | 13 | 12 |
| 2010 | 48 | 42 | 13 | 12 |
| 2011 | 49 | 40 | 13 | 13 |
| 2012 | 51 | 43 | 13 | 13 |
| 2013 | 55 | 32 | 12 | 14 |
| 2014 | 53 | 28 | 11 | 15 |
| 2015 | 56 | 28 | 12 | 20 |
| 2016 | 54 | 31 | 13 | 23 |
| 2017 | 55 | 30 | 17 | 22 |
| 2018 | 62 | 39 | 23 | 21 |
| 2019 | 65 | 44 | 26 | 21 |
| 2020 | 60 | 50 | 25 | 25 |
| 2021 | 72 | 62 | 45 | 25 |
| 2022 | 78 | 88 | 53 | 43 |
| 2023 | 85 | 58 | 76 | 41 |
| 2024 | 88 | 80 | 57 | 40 |
Interest-bearing debt
Interest-bearing debt includes unmatured debt, or debt issued on the credit markets, pension and other future benefit liabilities, and other liabilities.
- Unmatured debt, which includes fixed-coupon marketable bonds, Real Return Bonds, treasury bills, foreign-currency-denominated debt, and obligations related to capital leases and public-private partnerships, amounted to 78.9% of interest-bearing debt at March 31, 2024.
- Pension and other future benefit liabilities include obligations for: federal public sector pensions sponsored by the government; disability and associated benefits available to war veterans, current and retired members of the Canadian Forces and the Royal Canadian Mounted Police, their survivors and dependants; health care and dental benefits available to retired employees and their dependants; accumulated sick leave entitlements; severance benefits; workers' compensation benefits; and other future benefits sponsored by some consolidated Crown corporations and other entities. Liabilities for public sector pensions made up 9.5% of interest-bearing debt, and other employee and veteran future benefits accounted for an additional 11.2% of interest-bearing debt.
- The remaining 0.4% of interest-bearing debt represents other interest-bearing liabilities of the government, which include deposit and trust accounts and other specified purpose accounts.
The share of total interest-bearing debt represented by unmatured debt had been declining since the mid-1990s, as the government was able to retire some of this debt. This trend reversed in 2009 due to the increase in financial requirements stemming from the recession and stimulus measures introduced to mitigate its impacts, as well as an increase in borrowings under the consolidated borrowing framework introduced in 2008. Under the consolidated borrowing framework, the government finances all of the borrowing needs of CMHC, the Business Development Bank of Canada (BDC) and Farm Credit Canada (FCC) through direct lending in order to reduce overall borrowing costs and improve the liquidity of the government securities market. More recently, increased financial requirements due to the COVID-19 pandemic and Canada's Economic Response Plan contributed to a further increase in unmatured debt as a portion of interest-bearing debt.
Graph - Interest-bearing debt by category for 2024
Note: Numbers may not add to 100% due to rounding.
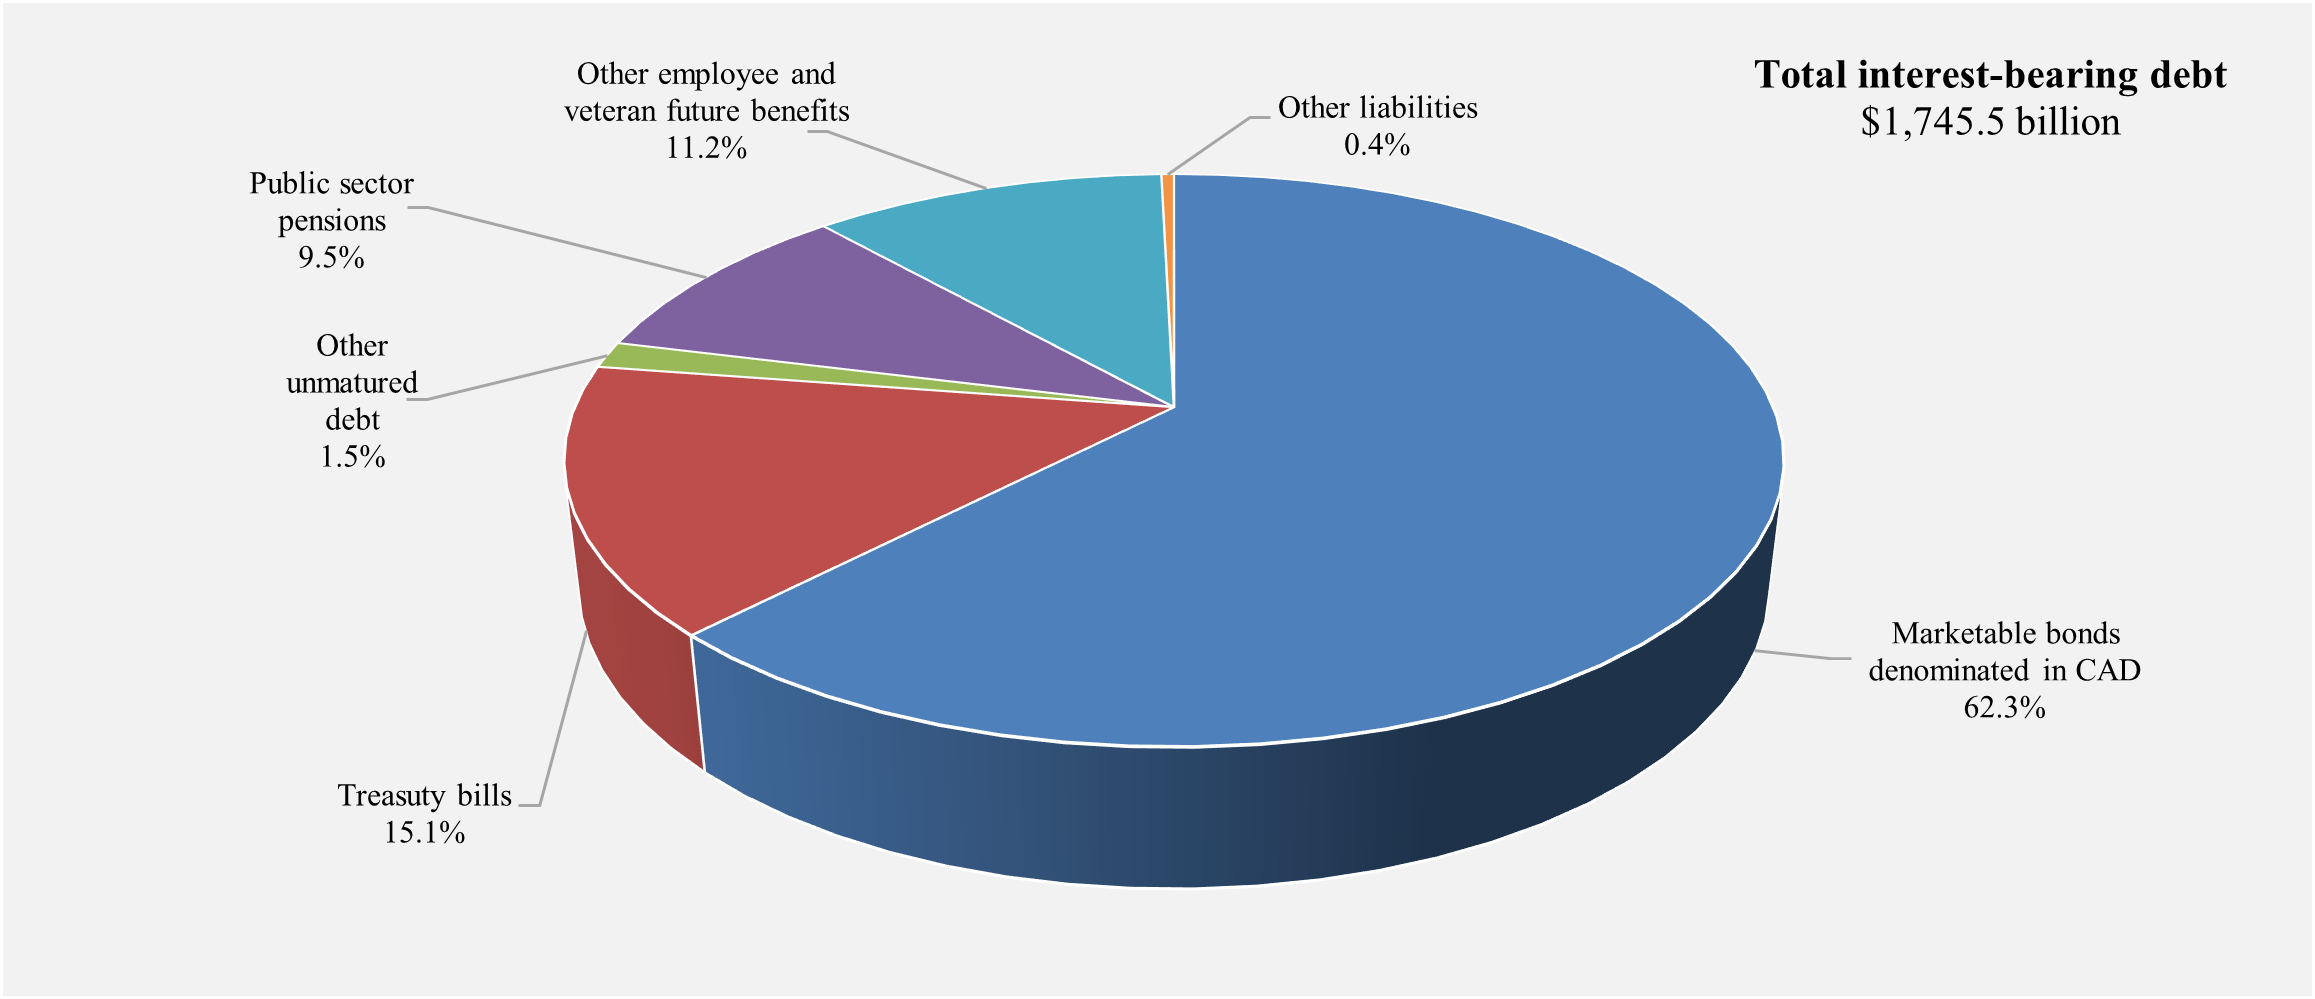
Image description
| Interest bearing debt | Percentage |
|---|---|
| Marketable bonds denominated in CAD | 62.3% |
| Treasury bills | 15.1% |
| Other unmatured debt | 1.5% |
| Public sector pensions | 9.5% |
| Other employee and veteran future benefits | 11.2% |
| Other liabilities | 0.4% |
At March 31, 2024, interest-bearing debt totalled $1,745.5 billion, up $128.7 billion from March 31, 2023. Within interest-bearing debt, unmatured debt increased by $111.8 billion and liabilities for other employee and veteran future benefits increased by $18.4 billion, while liabilities for public sector pensions decreased by $1.1 billion and other liabilities decreased by $0.4 billion.
The $111.8-billion increase in unmatured debt is largely attributable to a $112.0-billion increase in market debt and related unamortized discounts and premiums, reflecting increased borrowings to meet the government's financial requirements.
The Bank of Canada and the Department of Finance Canada manage the government's unmatured debt and associated risks. The fundamental objective of the debt management strategy is to provide stable, low-cost funding to meet the government's financial obligations and liquidity needs. The vast majority of debt is denominated in Canadian dollars. There is a small amount of borrowings denominated in US dollars, which fund a portion of the foreign exchange reserves. The reserves are managed under an asset-liability matching framework, and foreign exchange and interest rate risks are mitigated. Details on the government's debt management objectives, strategy, borrowing plans, and debt management activities are tabled annually in Parliament through the Department of Finance Canada's Debt Management Strategy and Debt Management Report.
Foreign holdings of the government's unmatured debt are estimated at $437.3 billion at March 31, 2024, representing approximately 31.8% of the government's total unmatured debt, up from 28.6% at March 31, 2023. Canada continues to benefit from the support of non-resident holders of government debt, which reflects the prudent approach to debt management and Canada's strong credit rating profile.
Foreign holdings of Government of Canada unmatured debt
(as a percentage of unmatured debt)
Source: Statistics Canada
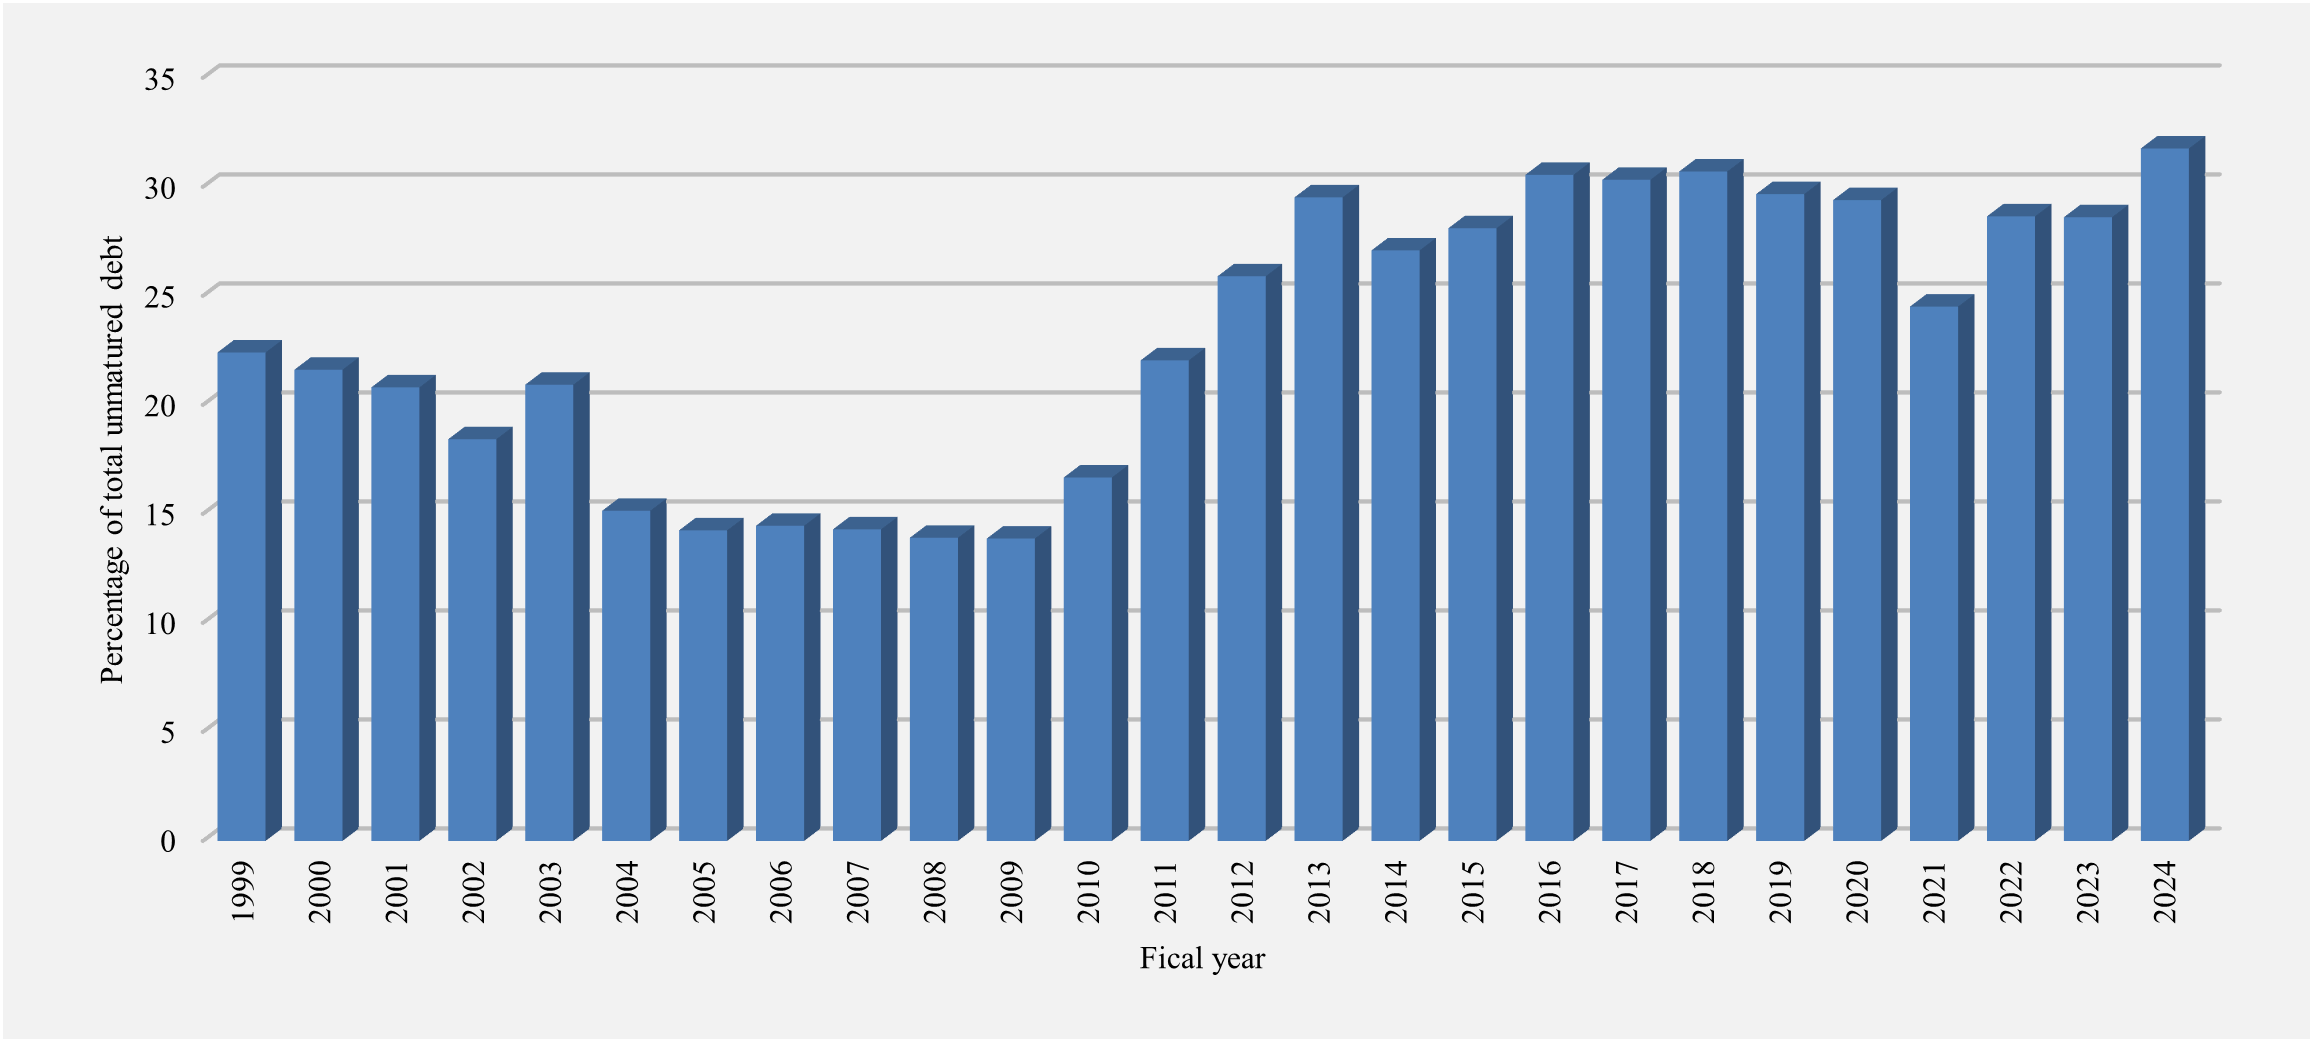
Image description
| Fiscal year | Percentage |
|---|---|
| 1999 | 22.4 |
| 2000 | 21.6 |
| 2001 | 20.8 |
| 2002 | 18.4 |
| 2003 | 20.9 |
| 2004 | 15.1 |
| 2005 | 14.2 |
| 2006 | 14.5 |
| 2007 | 14.3 |
| 2008 | 13.9 |
| 2009 | 13.9 |
| 2010 | 16.7 |
| 2011 | 22.0 |
| 2012 | 25.9 |
| 2013 | 29.5 |
| 2014 | 27.1 |
| 2015 | 28.1 |
| 2016 | 30.6 |
| 2017 | 30.3 |
| 2018 | 30.7 |
| 2019 | 29.7 |
| 2020 | 29.4 |
| 2021 | 24.5 |
| 2022 | 28.6 |
| 2023 | 28.6 |
| 2024 | 31.8 |
The government's liabilities for pensions and other future benefits stood at $361.7 billion at March 31, 2024, up $17.3 billion from the prior year. These liabilities reflect the estimated present value of pensions and other future benefits earned to March 31, 2024, by current and former employees, as measured annually on an actuarial basis, net of the value of assets set aside for funding purposes. Liabilities for pensions and other future benefits do not include benefits payable under the CPP. The CPP is not consolidated in the government's financial statements because changes to the CPP require the agreement of two-thirds of participating provinces and it is therefore not controlled by the government. Further information regarding the CPP can be found in Section 6 of this volume.
Accounting for public sector pensions and other employee and veteran future benefits
The government's $361.7-billion liability for public sector pensions and other employee and veteran future benefits results from its promise to provide certain benefits to employees, veterans, Members of Parliament, and employees of territorial governments during or after employment, or in retirement, in return for their service.
For benefits that accumulate over time as employees work, such as pensions, an annual expense and liability are generally recorded for the estimated cost of benefits earned by employees during the year. The government uses an actuarial cost method (the projected benefit method prorated on service) to estimate this expense and liability. Under this method, the government estimates the total expected future benefit payments for current employees. This total is then prorated over employees' eligible period of employment. This means that an equal portion of the estimate is expensed as current service cost in each year of an employee's eligible period of service, on a present value basis, assuming no change in discount rates and assumptions. Several actuarial assumptions are used in calculating current service cost, including future inflation, interest rates, return on pension investments, general wage increases, workforce composition, retirement rates and mortality rates.
For benefits or compensated absences that do not vest or accumulate, such as veteran future benefits and workers' compensation, a liability and expense for the expected cost of providing future benefits is recognized immediately in the period when the obligating event occurs. For example, some benefits provided to employees in the event of an accident or injury are recorded when the accident or injury occurs.
Since April 1, 2000, amounts equal to contributions less benefit payments and other charges that fall within the Income Tax Act limits are transferred to the Public Sector Pension Investment Board (PSPIB) for investment in relation to the public service, Canadian Forces–Regular Force and Royal Canadian Mounted Police pension plans, and since 2007 for the Canadian Forces–Reserve Force pension plan. Pension assets held by the PSPIB are valued at a market-related value. The government's accrued benefit obligations for public sector pensions and other employee and veteran future benefits are presented net of pension assets, as well as unrecognized net actuarial gains and losses (discussed below) and amounts related to the plans of some consolidated Crown corporations and other entities, in arriving at the liability for pensions and other future benefits shown on the Consolidated Statement of Financial Position.
Since the government's obligations for pensions and other future benefits are recorded on a present value basis, interest expense is recorded each year and added to the obligations to reflect the passage of time, as these liabilities are one year closer to settlement. Interest expense is recorded net of the expected return on the market-related value of investments for funded pension benefits and reported as part of public debt charges. Current service cost is recorded as part of other expenses excluding net actuarial losses on the Consolidated Statement of Operations and Accumulated Operating Deficit.
When an employee ceases employment with the government, the government stops recording current service cost in respect of that employee. Benefits subsequently provided to the employee are recorded as reductions in the government's benefit obligations.
The government's obligations for pensions and other future benefits are re-estimated on an annual basis to reflect actual experience and updated actuarial assumptions. Increases or decreases in the estimated value of the obligations are referred to as actuarial gains and losses. Actuarial gains and losses also result from differences between actual and expected returns on pension assets. Under Canadian public sector accounting standards, actuarial gains and losses are not recognized in the government's liabilities immediately due to their tentative nature and because further adjustments may be required in the future. Instead, these amounts are recognized to expense and to the government's liabilities over the expected average remaining service life of employees, which represents periods ranging from 4 to 23 years according to the plan in question and year in which the actuarial gain or loss originated, or the average remaining life expectancy of benefit recipients under wartime veteran plans, which represents periods ranging from 5 to 7 years.
For example:
- Actuarial gains and losses arising from March 31, 2024, re-estimations of obligations and differences between actual and expected returns on pension assets will be recognized over time (amortized) starting in 2025 as part of net actuarial losses on the Consolidated Statement of Operations and Accumulated Operating Deficit.
- Net actuarial losses recognized during 2024 reflect the amortization of actuarial gains and losses from 2023 and prior fiscal years.
The amount of net actuarial gains and losses amortized each year varies, as some actuarial gains and losses from previous fiscal years reach the end of their amortization periods and new actuarial gains and losses begin to be amortized.
Any plan amendments, curtailments and settlements that affect accrued benefit obligations for services already rendered by employees and veterans are reflected in the government's obligations in the period of the amendment, curtailment or settlement and recorded as part of other expenses excluding net actuarial losses.
The following table illustrates the change in the government's liabilities for pensions and other future benefits, net of public sector pension assets, in 2024.
| Pensions | Other future benefits | Total | |
|---|---|---|---|
| Net future benefit liabilities at beginning of year | 153,429 | 177,949 | 331,378 |
| Add: | |||
| Benefits earned during the year | 9,021 | 12,036 | 21,057 |
| Interest on accrued benefit obligations, net of the expected return on investments | 2,304 | 6,835 | 9,139 |
| Net actuarial losses recognized during the year | 285 | 7,205 | 7,490 |
| Valuation allowance | (negative 332) | – | (negative 332) |
| Subtotal | 11,278 | 26,076 | 37,354 |
| Deduct: | |||
| Benefits paid during the yearLinks to footnote 1 in table 20 | 15,819 | 7,548 | 23,367 |
| Transfers to the PSPIB and net use of funds held in external trustsLinks to footnote 2 in table 20 | 3,052 | – | 3,052 |
| Transfers to other plans and administrative expenses | 537 | 127 | 664 |
| Subtotal | 19,408 | 7,675 | 27,083 |
| Net (decrease) increase | (negative 8,130) | 18,401 | 10,271 |
| Net future benefit liabilities at end of year | 145,299 | 196,350 | 341,649 |
| Presented on the Consolidated Statement of Financial Position as: | |||
| Public sector pension liabilities | 165,354 | ||
| Other employee and veteran future benefit liabilities | 196,350 | ||
| Total pension and other future benefit liabilities | 361,704 | ||
| Public sector pension assets | 20,055 | ||
| Net pensions and other future benefit liabilities | 341,649 | ||
The increase in net liabilities for pensions and other future benefits in 2024 reflects the addition of $21.1 billion in future benefits earned by employees during the year, as well as $9.1 billion in net interest charges on the liabilities. The discount rates used in the measurement of the government-sponsored unfunded pension and other future benefit obligations and in calculating interest charges on the obligations are based on the actual zero-coupon yield curve for Government of Canada bonds at fiscal year-end. The discount rates used to value the government's obligations for funded pension benefits, which relate to post-March 2000 service that falls within the Income Tax Act limits under its three main pension plans—the public service, Canadian Forces–Regular Force, and Royal Canadian Mounted Police pension plans—as well as benefits under the Canadian Forces–Reserve Force pension plan are based on the streamed expected rates of return on invested funds.
The government's liabilities for pensions and other future benefits increased by an additional $7.5 billion in 2024 due to the recognition of net actuarial losses. As of March 31, 2024, the government had net unamortized gains of $8.8 billion. These gains will be amortized over time and recorded as part of net actuarial gains and losses and as a decrease in the government's liabilities.
These increases were offset in part by reductions in the liabilities for benefits paid during the year ($23.4 billion), net transfers to the PSPIB and net use of funds held in external trusts ($3.1 billion), transfers to other plans and administrative expenses ($0.7 billion), and a valuation allowance ($0.3 billion).
Further details on the federal public sector pensions and other employee and veteran future benefits are contained in Section 6 of this volume.
Interest-bearing debt stood at 59.5% of GDP in 2024, up from 56.7% in 2023. The sharp increase in interest-bearing debt in 2021 shown in the chart below reflects borrowings undertaken to meet the government's financial requirements under the COVID-19 Economic Response Plan. As of 2024, this ratio is down 15.4 percentage points from its high of 74.9% in 1996.
Graph - Interest-bearing debt
(as a percentage of GDP)
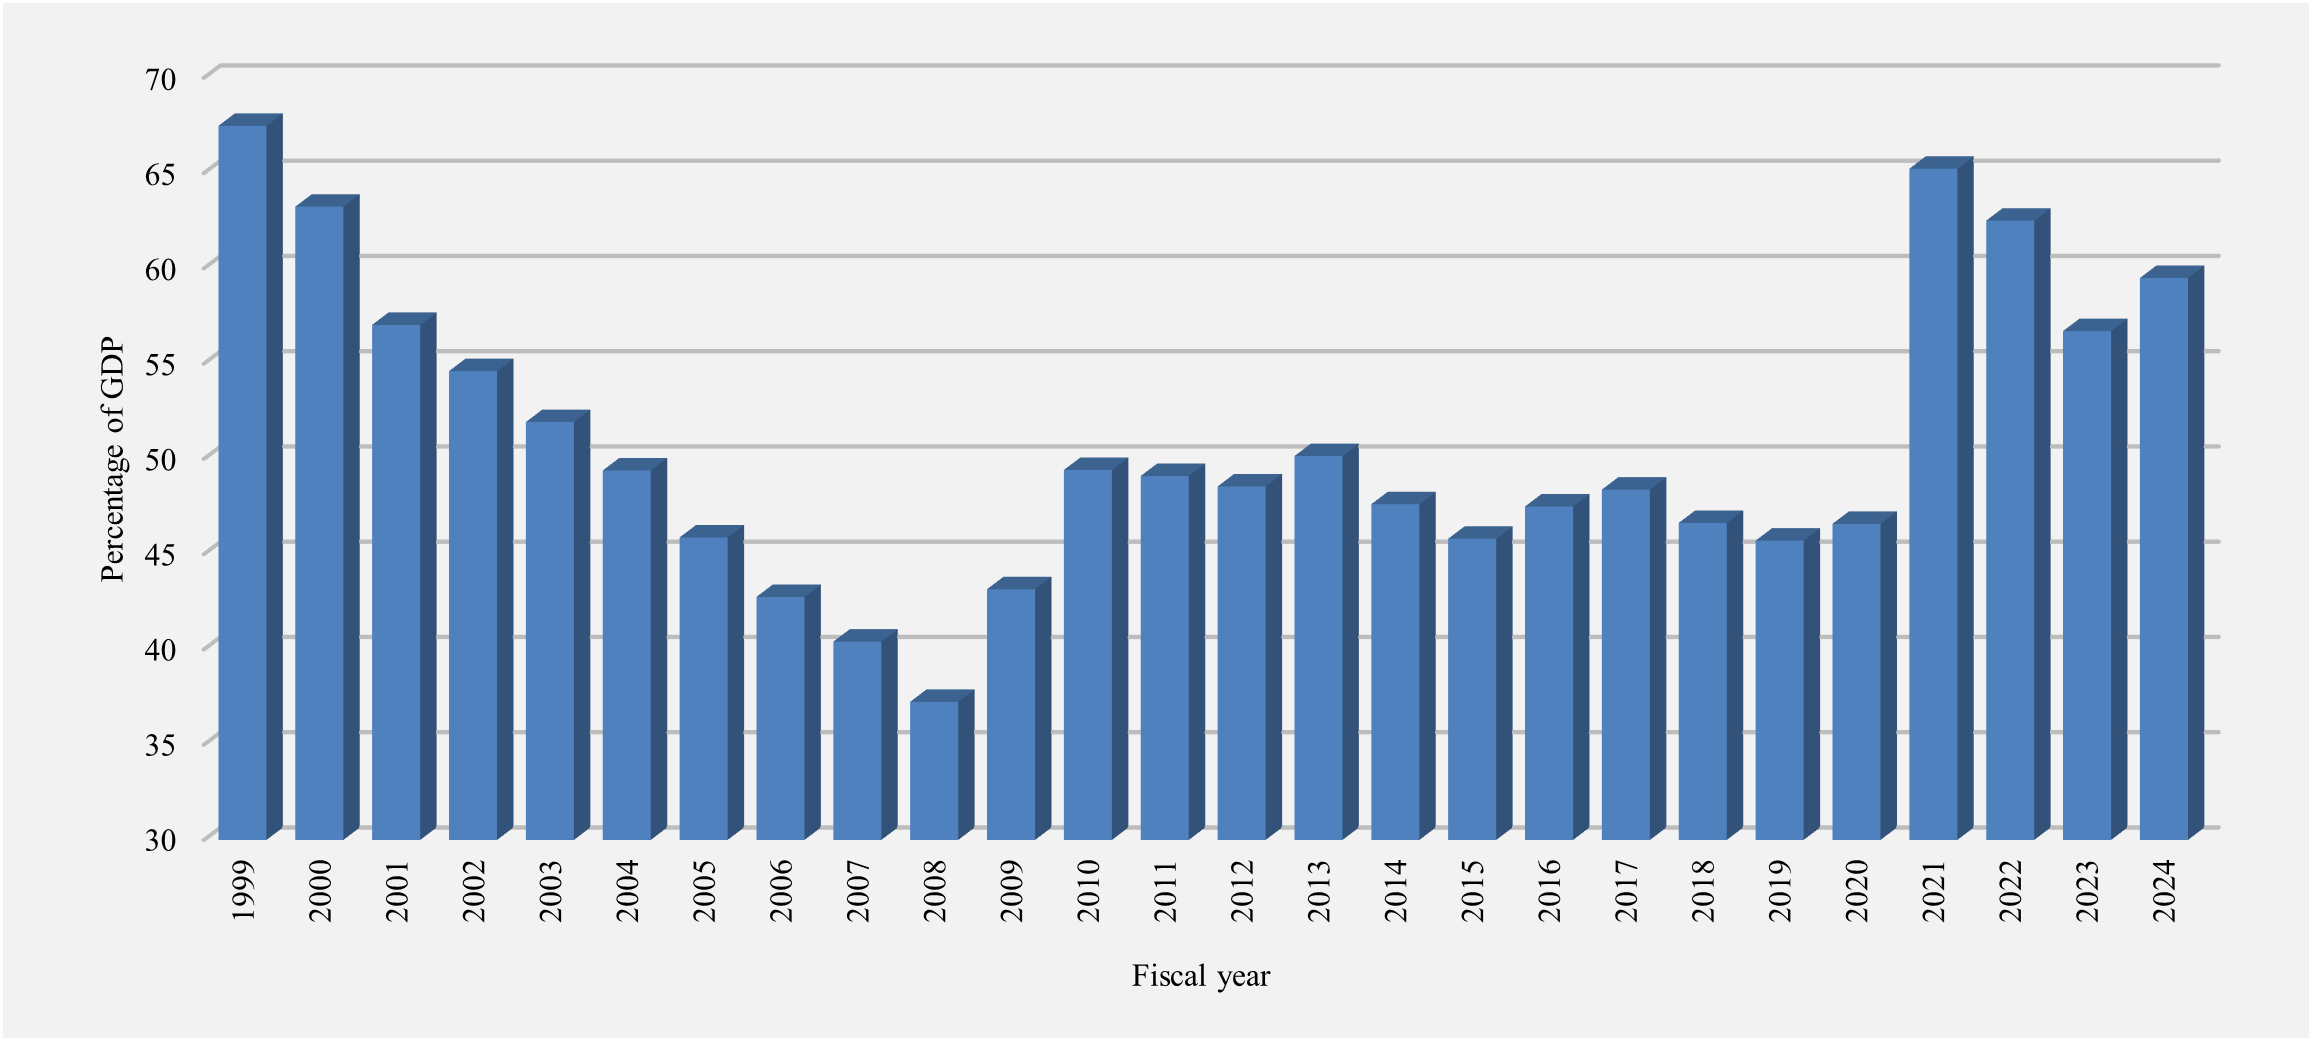
Image description
| Fiscal year | Percentage |
|---|---|
| 1999 | 67.5 |
| 2000 | 63.2 |
| 2001 | 57.0 |
| 2002 | 54.6 |
| 2003 | 51.9 |
| 2004 | 49.4 |
| 2005 | 45.9 |
| 2006 | 42.8 |
| 2007 | 40.4 |
| 2008 | 37.2 |
| 2009 | 43.2 |
| 2010 | 49.4 |
| 2011 | 49.1 |
| 2012 | 48.6 |
| 2013 | 50.1 |
| 2014 | 47.6 |
| 2015 | 45.8 |
| 2016 | 47.5 |
| 2017 | 48.4 |
| 2018 | 46.6 |
| 2019 | 45.7 |
| 2020 | 46.6 |
| 2021 | 65.2 |
| 2022 | 62.5 |
| 2023 | 56.7 |
| 2024 | 59.5 |
The average effective interest rate on the government's interest-bearing debt in 2024 was 2.8%, up from 2.2% in 2023. The average effective interest rate on unmatured debt and cross-currency swaps was 2.8%, while the average effective interest rate on pension and other liabilities was 2.9%.
Average effective interest rate on interest-bearing debt
(in percentage)
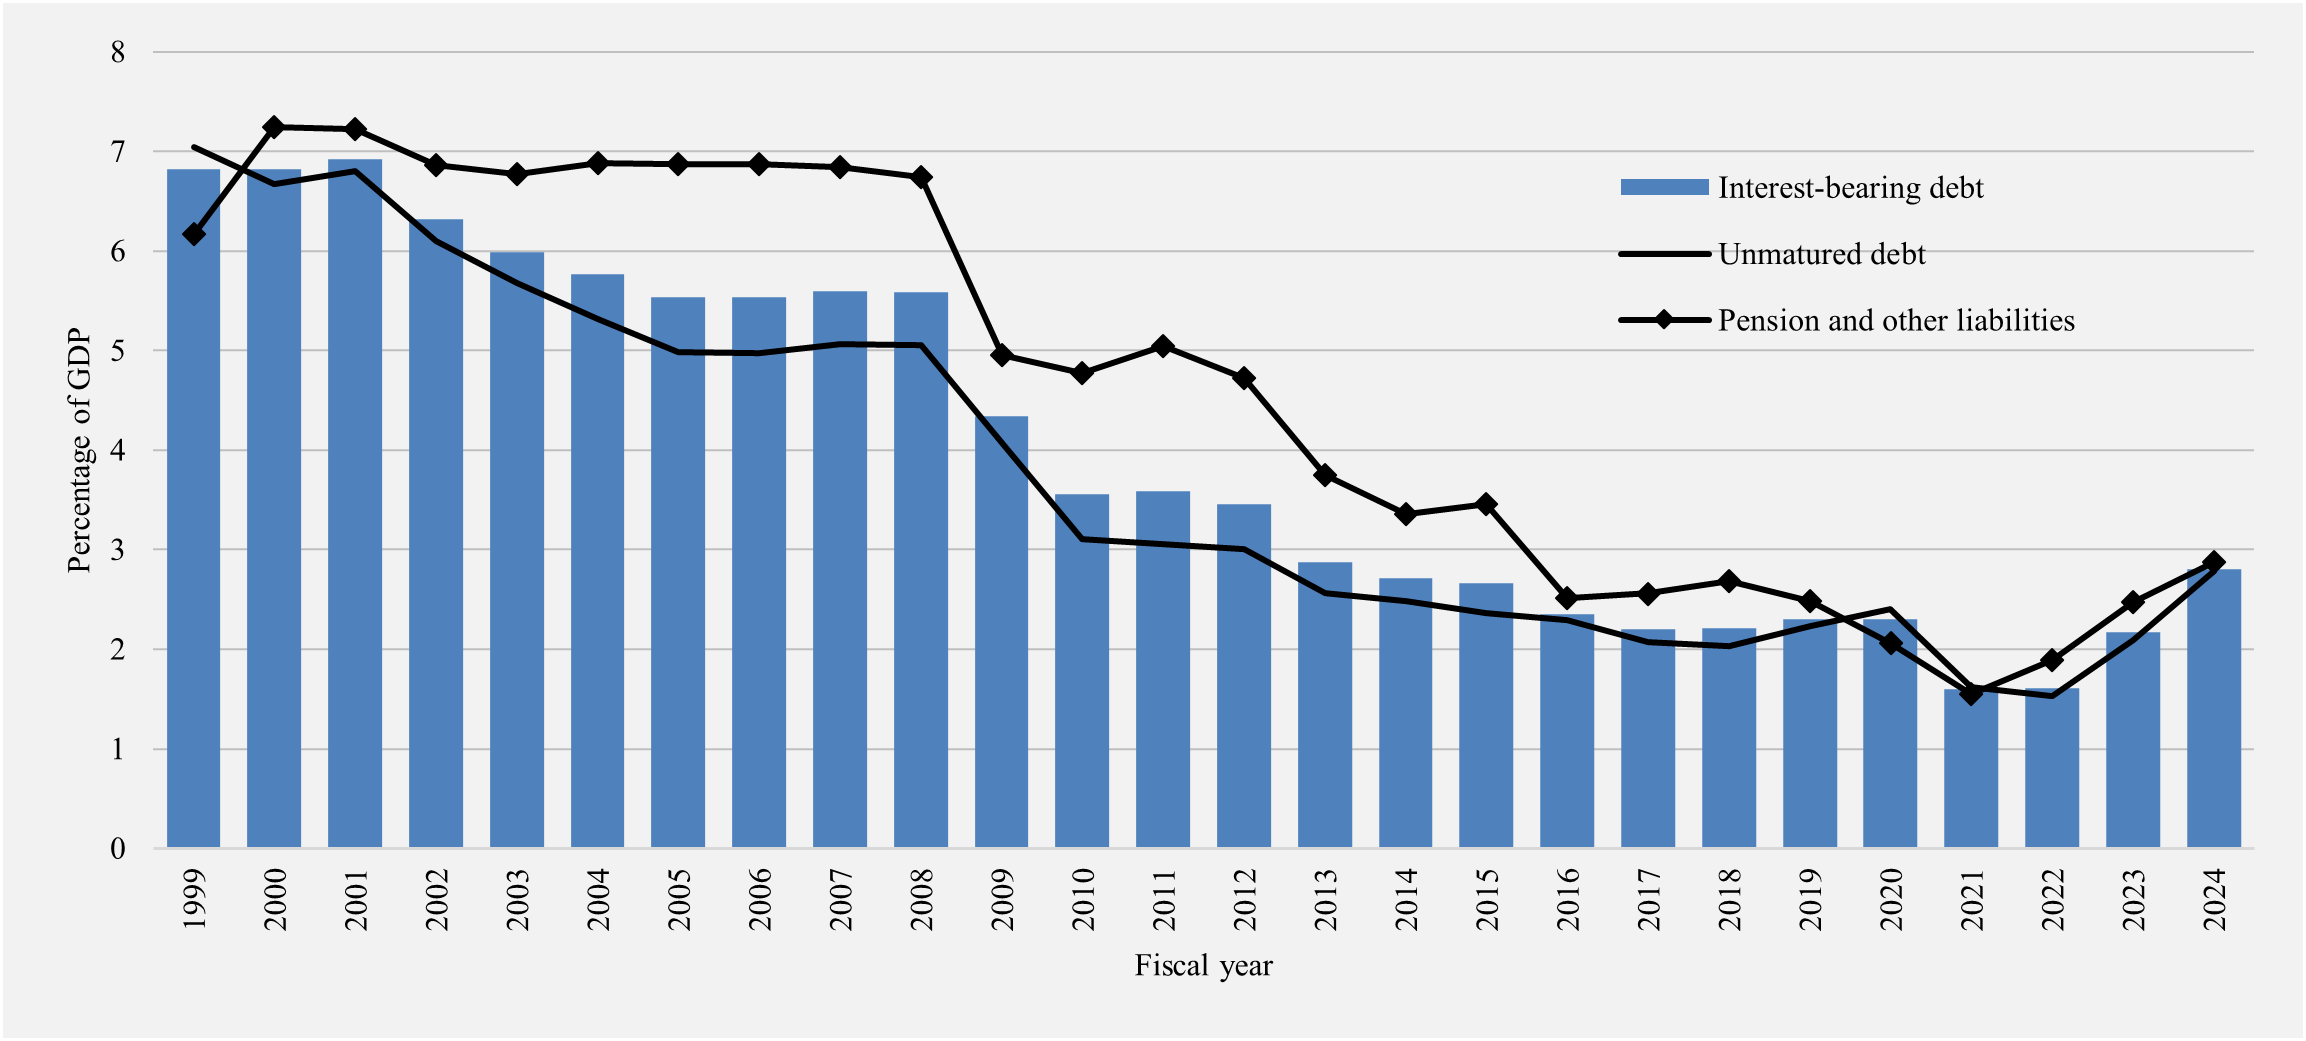
Image description
| Fiscal year | Interest-bearing debt percentage | Unmatured debt percentage | Pension and other liabilities percentage |
|---|---|---|---|
| 1999 | 6.8 | 7.0 | 6.2 |
| 2000 | 6.8 | 6.7 | 7.2 |
| 2001 | 6.9 | 6.8 | 7.2 |
| 2002 | 6.3 | 6.1 | 6.9 |
| 2003 | 6.0 | 5.7 | 6.8 |
| 2004 | 5.8 | 5.3 | 6.9 |
| 2005 | 5.5 | 5.0 | 6.9 |
| 2006 | 5.5 | 5.0 | 6.9 |
| 2007 | 5.6 | 5.1 | 6.8 |
| 2008 | 5.6 | 5.1 | 6.7 |
| 2009 | 4.3 | 4.1 | 5.0 |
| 2010 | 3.6 | 3.1 | 4.8 |
| 2011 | 3.6 | 3.1 | 5.0 |
| 2012 | 3.5 | 3.0 | 4.7 |
| 2013 | 2.9 | 2.6 | 3.8 |
| 2014 | 2.7 | 2.5 | 3.4 |
| 2015 | 2.7 | 2.4 | 3.5 |
| 2016 | 2.3 | 2.3 | 2.5 |
| 2017 | 2.2 | 2.1 | 2.6 |
| 2018 | 2.2 | 2.0 | 2.7 |
| 2019 | 2.3 | 2.2 | 2.5 |
| 2020 | 2.3 | 2.4 | 2.1 |
| 2021 | 1.6 | 1.6 | 1.5 |
| 2022 | 1.6 | 1.5 | 1.9 |
| 2023 | 2.2 | 2.1 | 2.5 |
| 2024 | 2.8 | 2.8 | 2.9 |
The interest ratio (public debt charges as a percentage of revenues) shows the proportion of every dollar of revenue that is needed to pay interest and is therefore not available to pay for program initiatives. The interest ratio had been decreasing in recent years, falling from a peak of 37.6% in 1991 to 5.9% in 2022. The ratio has since increased to 10.3% in 2024, reflecting growth in the stock of debt and an increase in interest rates. This means that, in 2024, the government spent approximately 10 cents of every revenue dollar on servicing the public debt, which is still relatively low by historical standards.
Interest ratio
(public debt charges as a percentage of revenues)

Image description
| Fiscal year | Percentage |
|---|---|
| 1999 | 26.2 |
| 2000 | 24.6 |
| 2001 | 22.6 |
| 2002 | 21.6 |
| 2003 | 19.6 |
| 2004 | 17.8 |
| 2005 | 15.9 |
| 2006 | 15.1 |
| 2007 | 14.2 |
| 2008 | 13.6 |
| 2009 | 11.9 |
| 2010 | 12.0 |
| 2011 | 12.0 |
| 2012 | 11.8 |
| 2013 | 10.0 |
| 2014 | 9.2 |
| 2015 | 8.6 |
| 2016 | 7.5 |
| 2017 | 7.3 |
| 2018 | 7.0 |
| 2019 | 7.0 |
| 2020 | 7.3 |
| 2021 | 6.4 |
| 2022 | 5.9 |
| 2023 | 7.8 |
| 2024 | 10.3 |
Foreign exchange accounts liabilities and derivatives
Foreign exchange accounts liabilities include Special Drawing Rights (SDR) allocations and notes payable to the International Monetary Fund (IMF). The SDR is an international reserve asset created by the IMF and allocated to countries participating in its Special Drawing Rights Department. SDRs represent both an asset (a holder of SDRs has the right to exchange them for an equivalent amount of freely usable currency, or other reserve assets, of other countries participating in the IMF's SDR Department) and a liability (an allocation of SDRs by the IMF entails an obligation to provide, on demand, an equivalent amount of freely usable currency to another IMF member). SDR holdings are recorded in foreign exchange accounts assets. The government's foreign exchange accounts liabilities at March 31, 2024, stood at $44.1 billion, down $45 million from a year earlier primarily due to foreign exchange rate movements, which resulted in the liabilities depreciating against the Canadian dollar.
Derivatives represent financial contracts whose value is derived by reference to a rate, index, or underlying asset. The government uses derivatives for hedging purposes to manage various types of financial risk. With the adoption of new accounting standards on financial instruments in 2023, derivatives are presented separately from other types of liabilities and are recorded at fair value. Derivatives estimated to require a net outflow of resources if terminated on March 31 are presented as liabilities, while derivatives estimated to result in a net inflow of resources if terminated on March 31 are presented as assets. Derivative liabilities decreased by $0.6 billion to $4.1 billion at March 31, 2024, reflecting changes in fair value, foreign exchange rates, and contracts that matured during 2024.
Financial assets
Financial assets include cash on deposit with the Bank of Canada, chartered banks and other financial institutions, accounts receivable, foreign exchange accounts assets, derivatives, loans, investments and advances, and public sector pension assets. The government's foreign exchange accounts assets include foreign currency deposits, investments in marketable securities, and subscriptions and loans to the IMF. Proceeds of the government's foreign currency borrowings are held in the Exchange Fund Account to provide foreign currency liquidity and provide funds needed to promote orderly conditions for the Canadian dollar in foreign exchange markets. Further details on the management of international reserves, including foreign currency and interest rate risk, are available in the annual Report on the Management of Canada's Official International Reserves. The government's derivative assets include cross-currency swaps and foreign exchange forward agreements. The government's loans, investments and advances include its investments in and loans to enterprise Crown corporations, loans to national governments mainly for financial assistance and development of export trade, loans under the Canada Student Loans Program, and loans to small businesses and not-for-profits under the CEBA program.
Financial assets by category for 2024
Note: Numbers may not add to 100% due to rounding.
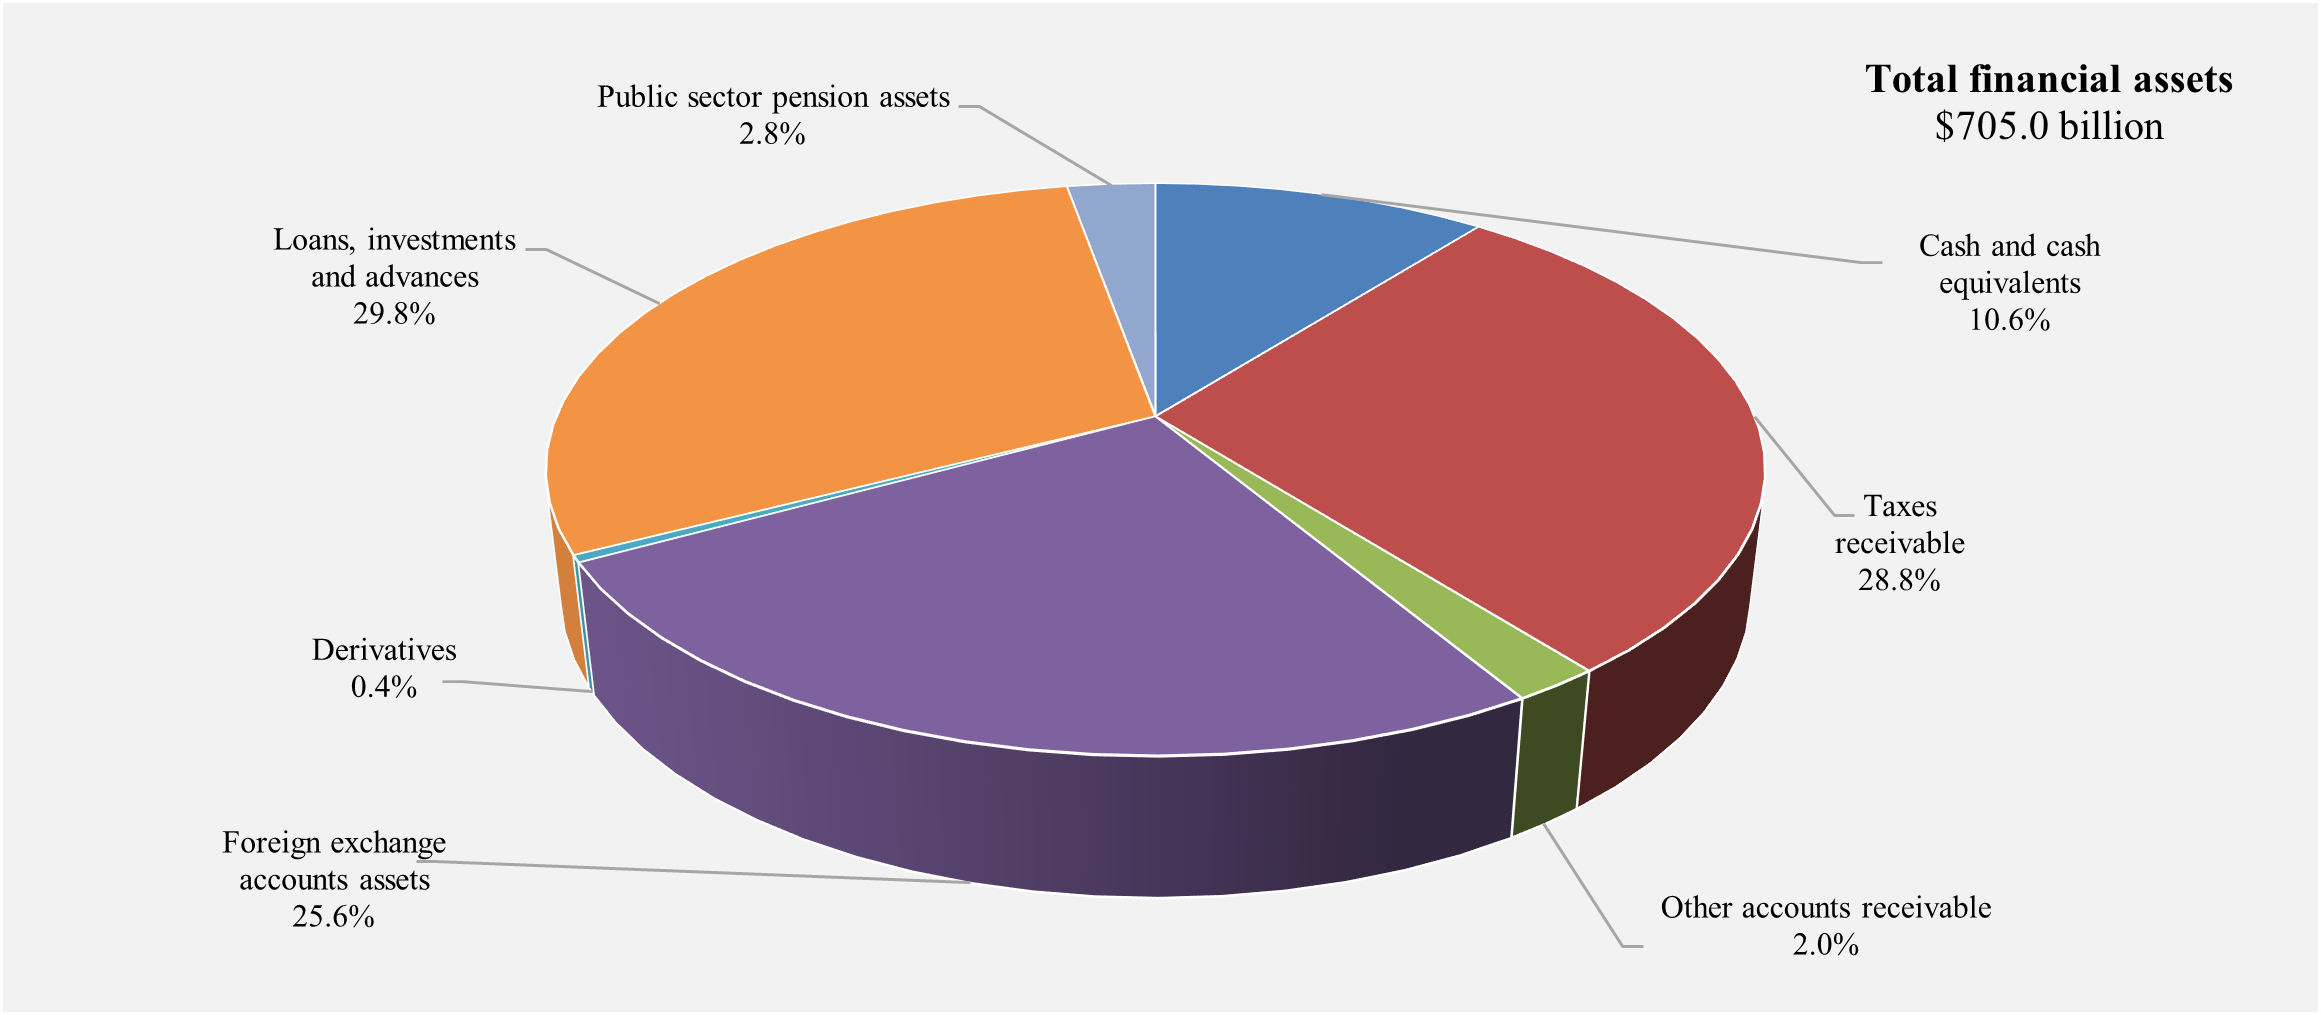
Image description
| Financial assets | Percentage |
|---|---|
| Cash and cash equivalents | 10.6% |
| Taxes receivable | 28.8% |
| Other accounts receivable | 2% |
| Foreign exchange accounts assets | 25.6% |
| Derivatives | 0.4% |
| Loans, investments and advances | 29.8% |
| Public sector pension assets | 2.8% |
At March 31, 2024, financial assets amounted to $705.0 billion, up $62.8 billion from March 31, 2023. The increase reflects growth in cash and accounts receivable, foreign exchange accounts assets, and public sector pension assets, offset in part by a decrease in derivatives and loans, investments and advances.
At March 31, 2024, cash and accounts receivable totalled $292.1 billion, up $48.6 billion from March 31, 2023. Within this component, cash and cash equivalents increased by $26.1 billion, as the government maintained higher cash balances at March 31, 2024, in preparation for a large debt maturity on April 1, 2024. The balance of cash and cash equivalents at March 31, 2024, includes $20.0 billion that has been designated as a deposit held with respect to prudential liquidity management, as well as $8.0 billion in term deposits from the recent reintroduction of morning auctions of Receiver General cash balances. The morning auctions are conducted by the Bank of Canada in its role as fiscal agent for the Government of Canada and allow the government to invest excess cash balances in a prudent and cost-effective manner. Taxes receivable increased by $22.1 billion during 2024 to $203.0 billion, reflecting a number of factors, including growth in tax revenues, a higher prescribed interest rate, and an increase in corporations' arrears. Other accounts receivable increased by $0.5 billion largely reflecting net increases in COVID-19 benefit overpayments receivable from individuals and businesses, and year-over-year timing differences in the assessment of fuel charges, offset in part by the receipt during 2024 of dividends receivable from CMHC at March 31, 2023.
Loans, investments and advances in enterprise Crown corporations and other government business enterprises increased by $14.3 billion in 2024. Investments in enterprise Crown corporations and other government business enterprises decreased $2.0 billion, largely reflecting $1.4 billion in dividends paid to the government, and $0.7 billion in net losses and $0.2 billion in other comprehensive losses recorded by these entities during 2024, offset in part by $0.3 billion in net equity contributions to these corporations and enterprises during the year. Additionally, other investments in enterprise Crown corporations and other government business enterprises rose $7.6 billion due to the government's purchases of CMBs from CMHC, which began in 2024. Net loans and advances to enterprise Crown corporations and other government business enterprises were up $8.7 billion. This growth primarily reflects a $7.9-billion increase in loans to Crown corporations under the consolidated borrowing framework to finance the operational needs of BDC, CMHC and FCC.
Other loans, investments and advances decreased by $17.6 billion, from $62.1 billion to $44.5 billion, primarily reflecting a decrease in CEBA loans outstanding following the January 18, 2024, forgiveness repayment date (or by March 28, 2024, for those that applied for refinancing with the financial institution that provided their CEBA loan on or before January 18, 2024) and a concessionary discount on the value of Canada Student Loans recorded in 2024 to reflect the elimination of interest effective April 1, 2023. These decreases were partly offset by net issuances of Canada Student Loans, loans to national governments, and loans by Canada Infrastructure Bank.
Purchases of Canada Mortgage Bonds
Following a consultation held during the summer of 2023 on the proposal to consolidate CMBs into the regular Government of Canada borrowing program, the government announced in the 2023 Fall Economic Statement that it would purchase up to an annual maximum of $30 billion of CMBs. The government began these purchases in February 2024.
CMBs are issued by CMHC and sold to investors to generate funds for residential mortgage financing. The purchase of CMBs allows the government to generate additional net revenues to channel to initiatives such as affordable housing. CMBs are typically issued at a spread above the yields of corresponding Government of Canada securities despite bearing the full faith and credit of the Government of Canada. Consequently, the purchase of CMBs generates interest return in the form of coupon payments higher than the government's cost of funding without increasing its risk exposure.
The government' consolidated statement of financial position is impacted by the acquisition of CMBs through an increase in the stock of gross debt of the government since purchases are funded by additional debt issuance. However, there is no impact on net debt since the government holds corresponding financial assets. As of March 31, 2024, the government had purchased $7.6 billion of CMBs, which are reported as assets within the government's Loans, investments and advances on the Consolidated Statement of Financial Position. The total funding for these purchases represents 0.4% of the government's total liabilities as of March 31, 2024.
Canada Emergency Business Account
The Canada Emergency Business Account was announced by the government in March 2020 as part of Canada's COVID-19 Economic Response Plan to support businesses and not-for-profit organizations adversely affected by the pandemic. The program was available from April 2020 to June 2021 and provided eligible businesses and organizations with financial support in the form of interest-free partially forgivable loans of up to $60,000 to help cover their operating costs. In total, the program provided over $49 billion in loans to nearly 900,000 small businesses and not-for-profit organizations. For eligible CEBA loan holders in good standing, repaying the balance of the loan on or before January 18, 2024, resulted in loan forgiveness of up to 33% (up to $20,000) and businesses that sought refinancing in order to repay their loans had until March 28, 2024, to qualify for partial loan forgiveness. As of March 31, 2024, approximately $28 billion of loans had been repaid, resulting in $12 billion in loan forgiveness. The cost of this forgiveness was expensed as the loans were disbursed in fiscal years 2021 and 2022.
Eligible CEBA loans that remain outstanding are now converted to term loans bearing interest of 5%, with full principal repayment due on December 31, 2026. This three-year, low-interest term loan will provide eligible borrowers with additional time to continue repayment at a low borrowing cost. The government's approach to collecting funds is focused on helping borrowers resolve their debts, while applying laws and regulations in a uniform and fair way.
Public sector pension assets increased by $7.1 billion, largely reflecting increases in the net assets under the Public Service Pension Fund and Canadian Forces Pension Fund, which pertain to service accrued on or after April 1, 2000, that falls within the Income Tax Act limits under the Public Service Superannuation Act and the Canadian Forces Superannuation Act, respectively.
Foreign exchange accounts assets increased by $10.8 billion in 2024, totalling $180.1 billion at March 31, 2024, due mainly to net advances to the Exchange Fund Account.
Derivative assets decreased $0.3 billion to $2.9 billion at March 31, 2024.
Since the accumulated deficit reached its post-World War II peak of 66.6% of GDP at March 31, 1996, financial assets have increased by $603.9 billion, mainly reflecting higher levels of cash and cash equivalents and accounts receivable (up $239.5 billion), an increase in foreign exchange accounts assets (up $152.7 billion), and an increase in loans, investments and advances (up $188.8 billion). The increase in cash and cash equivalents and accounts receivable is largely attributable to growth in taxes receivable and cash balances. The increase in taxes receivable reflects growth in the applicable tax bases, while the growth in cash reflects an increase in balances held under the government's prudential liquidity management plan announced in Budget 2011. The increase in the foreign exchange accounts reflects a decision by the government in the late 1990s and more recently in the 2012 Debt Management Strategy to increase liquidity in these accounts. The increase in loans, investments and advances is attributable to several factors including the accumulation of net profits from enterprise Crown corporations, the government taking over the financing of the Canada Student Loans Program from the chartered banks in 2000, the issuance of direct loans to Crown corporations under the government's consolidated borrowing framework implemented in 2008, and most recently, purchases of CMBs from the Canada Mortgage and Housing Corporation to lower the government's overall borrowing costs.
Graph - Financial assets
(in billions of dollars)
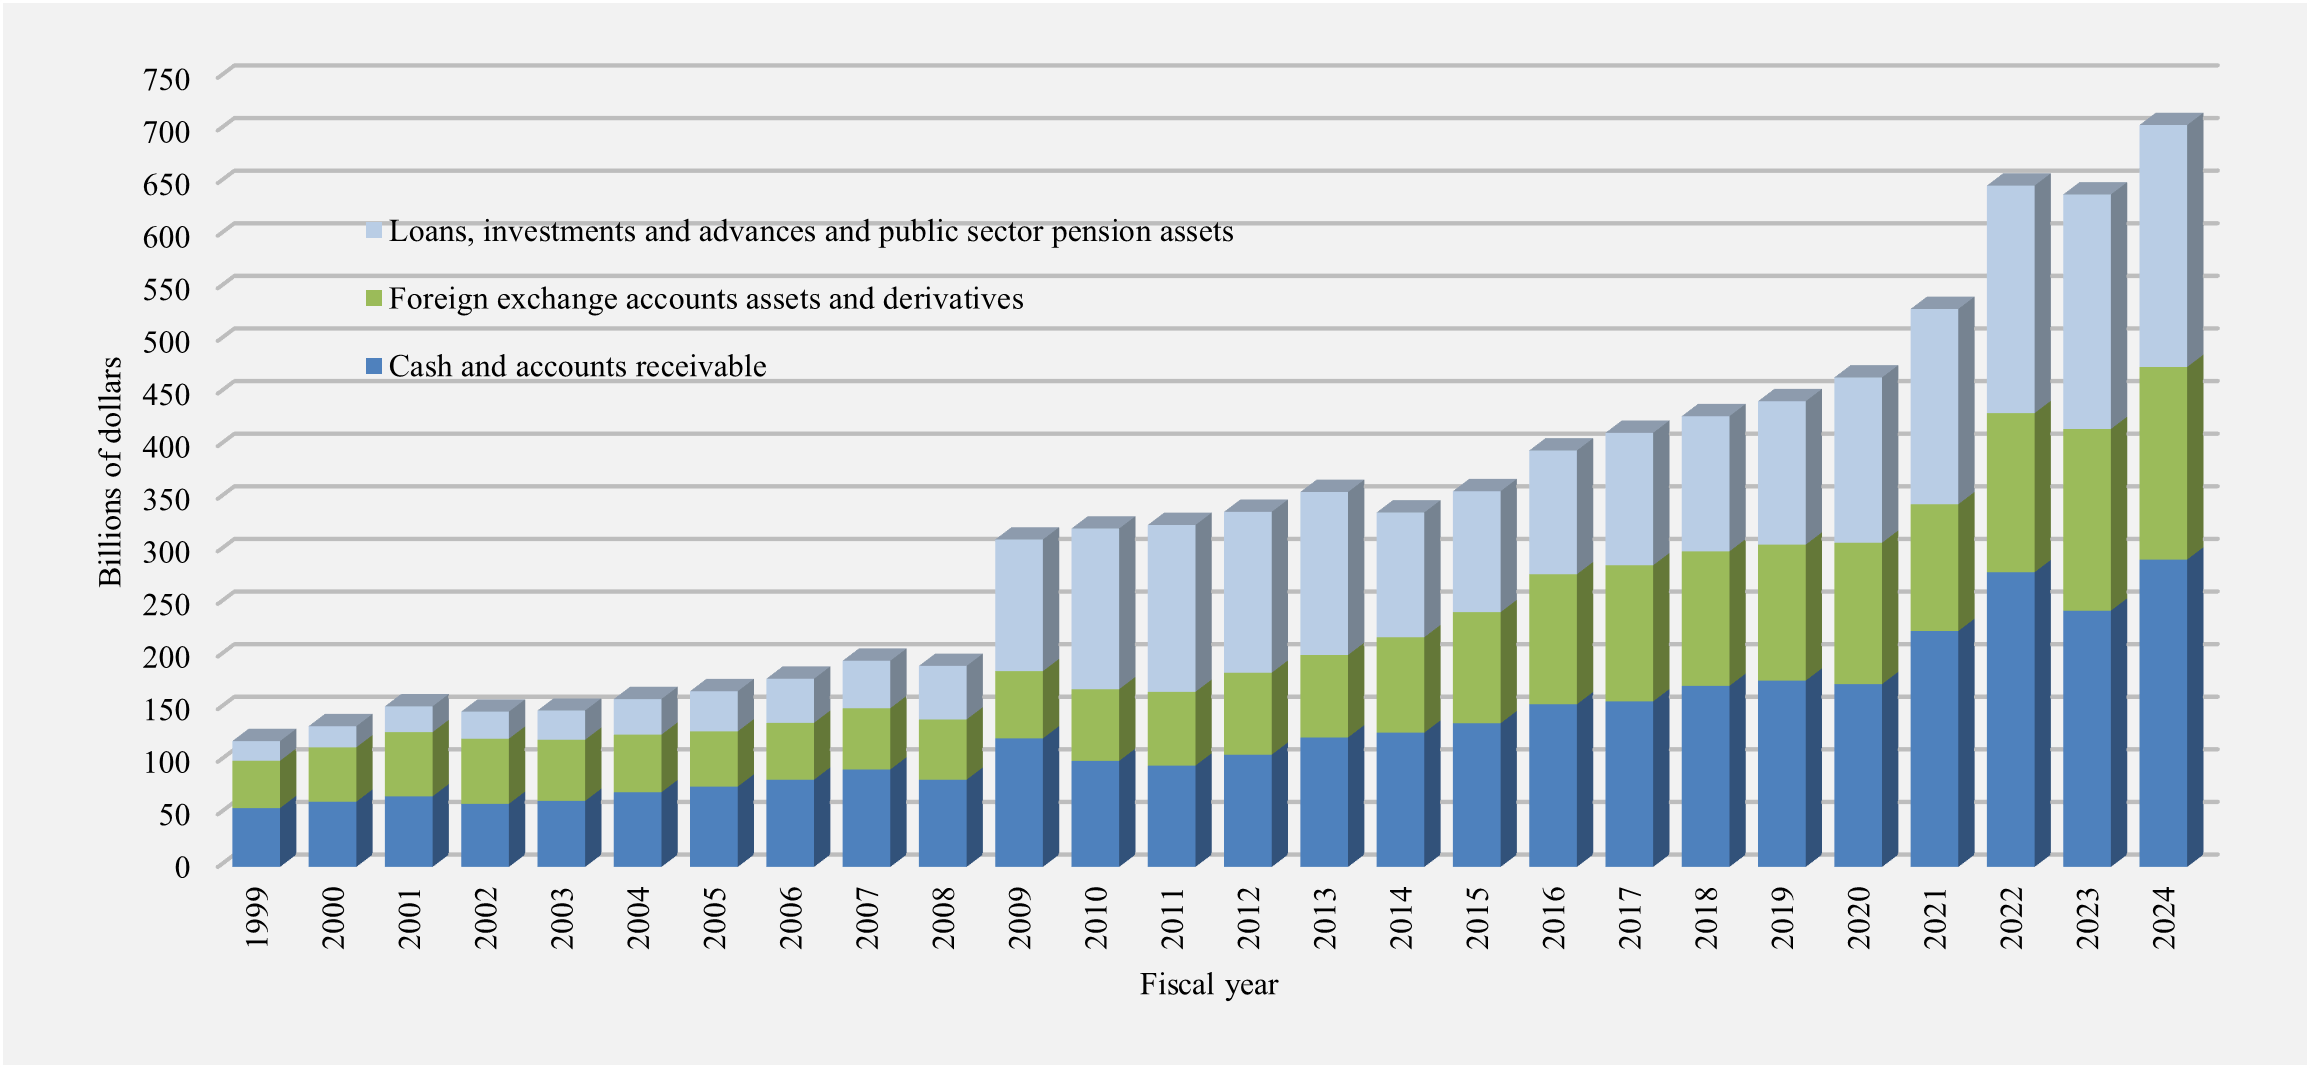
Image description
| Fiscal year | Cash and accounts receivable | Foreign exchange accounts assets and derivatives | Loans, investments and advances and public sector pension assets | Total |
|---|---|---|---|---|
| 1999 | 56 | 45 | 19 | 120 |
| 2000 | 62 | 52 | 20 | 134 |
| 2001 | 67 | 61 | 25 | 153 |
| 2002 | 60 | 62 | 26 | 148 |
| 2003 | 63 | 58 | 28 | 149 |
| 2004 | 71 | 55 | 34 | 160 |
| 2005 | 76 | 52 | 38 | 167 |
| 2006 | 83 | 54 | 42 | 179 |
| 2007 | 93 | 58 | 45 | 196 |
| 2008 | 83 | 57 | 51 | 191 |
| 2009 | 122 | 64 | 125 | 311 |
| 2010 | 101 | 68 | 153 | 322 |
| 2011 | 96 | 70 | 159 | 325 |
| 2012 | 107 | 78 | 153 | 337 |
| 2013 | 123 | 78 | 155 | 356 |
| 2014 | 128 | 91 | 119 | 337 |
| 2015 | 137 | 106 | 115 | 357 |
| 2016 | 155 | 124 | 118 | 396 |
| 2017 | 157 | 129 | 126 | 413 |
| 2018 | 172 | 128 | 128 | 428 |
| 2019 | 177 | 129 | 136 | 443 |
| 2020 | 174 | 134 | 157 | 465 |
| 2021 | 224 | 120 | 186 | 530 |
| 2022 | 280 | 151 | 216 | 648 |
| 2023 | 244 | 173 | 223 | 639 |
| 2024 | 292 | 183 | 230 | 705 |
Net debt
The government's net debt—its total liabilities less financial assets—stood at $1,352.8 billion at March 31, 2024. Net debt was 46.1% of GDP, up 1.1 percentage points from a year earlier, and 25.9 percentage points below its peak of 72.0% at March 31, 1996. The increase in net debt as a percentage of GDP since 2020 reflects borrowings undertaken to meet the government's financial requirements under the COVID-19 Economic Response Plan.
This ratio measures debt relative to the ability of the country's taxpayers to finance it. Total liabilities are reduced only by financial assets as non-financial assets cannot normally be converted to cash to pay off the debt without disrupting government operations.
Graph - Net debt
(as a percentage of GDP)
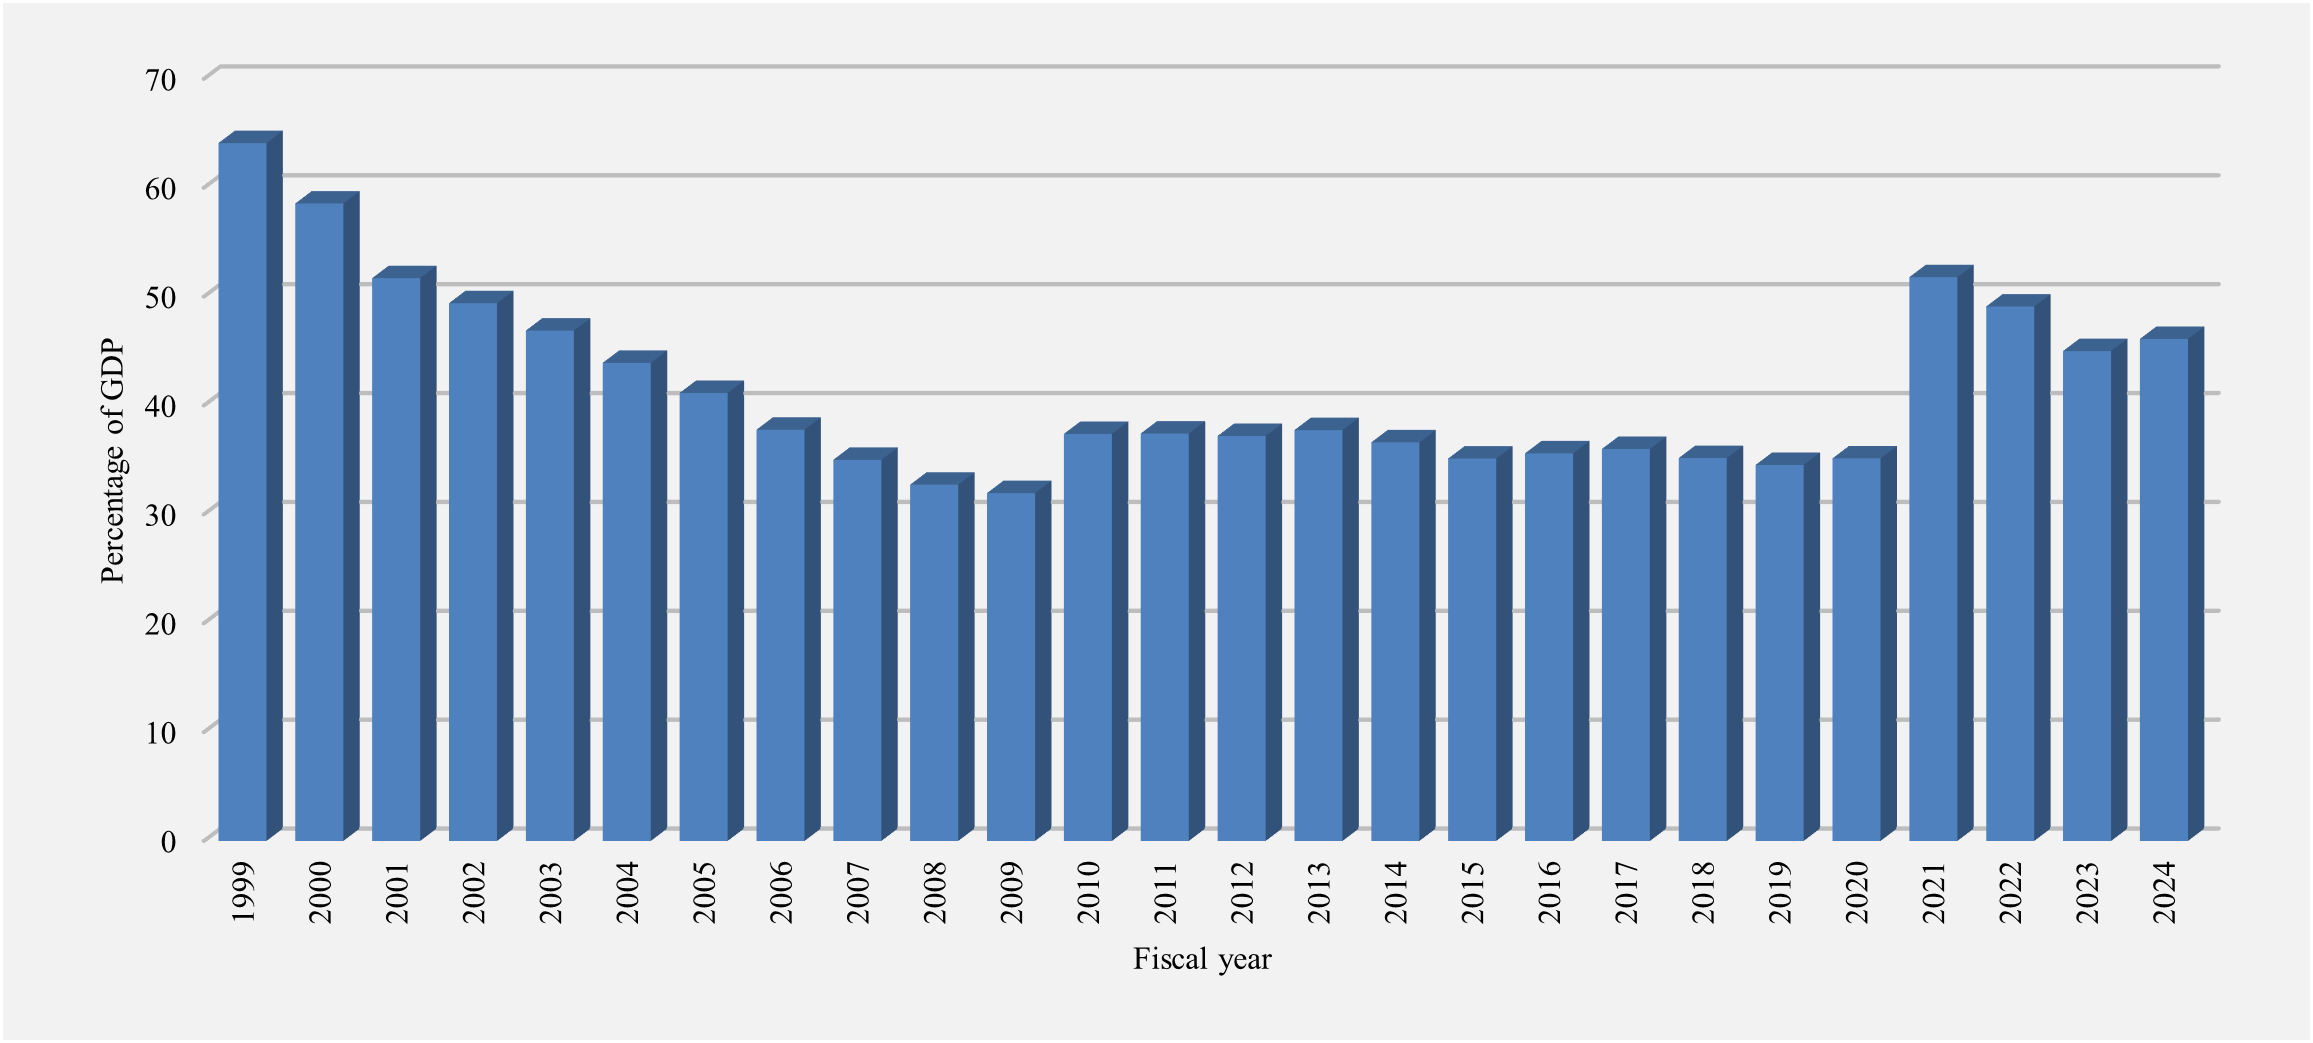
Image description
| Fiscal year | Percentage |
|---|---|
| 1999 | 64.1 |
| 2000 | 58.5 |
| 2001 | 51.7 |
| 2002 | 49.4 |
| 2003 | 46.9 |
| 2004 | 43.9 |
| 2005 | 41.1 |
| 2006 | 37.8 |
| 2007 | 35.0 |
| 2008 | 32.7 |
| 2009 | 32.0 |
| 2010 | 37.4 |
| 2011 | 37.4 |
| 2012 | 37.2 |
| 2013 | 37.7 |
| 2014 | 36.6 |
| 2015 | 35.1 |
| 2016 | 35.6 |
| 2017 | 36.0 |
| 2018 | 35.2 |
| 2019 | 34.5 |
| 2020 | 35.1 |
| 2021 | 51.8 |
| 2022 | 49.1 |
| 2023 | 45.0 |
| 2024 | 46.1 |
International comparisons of net debt
Jurisdictional responsibility (between central, state, and local levels of government) for government programs differs among countries. As a result, international comparisons of government fiscal positions are undertaken on a total government, National Accounts basis. For Canada, total government net debt includes that of the federal, provincial/territorial, and local governments, as well as the net assets held in the Canada Pension Plan and Quebec Pension Plan.
Canada has the lowest total government net debt burden among G7 countries
G7 total government net debt, 2023
(as a percentage of GDP)
Source: IMF October 2024 Fiscal Monitor
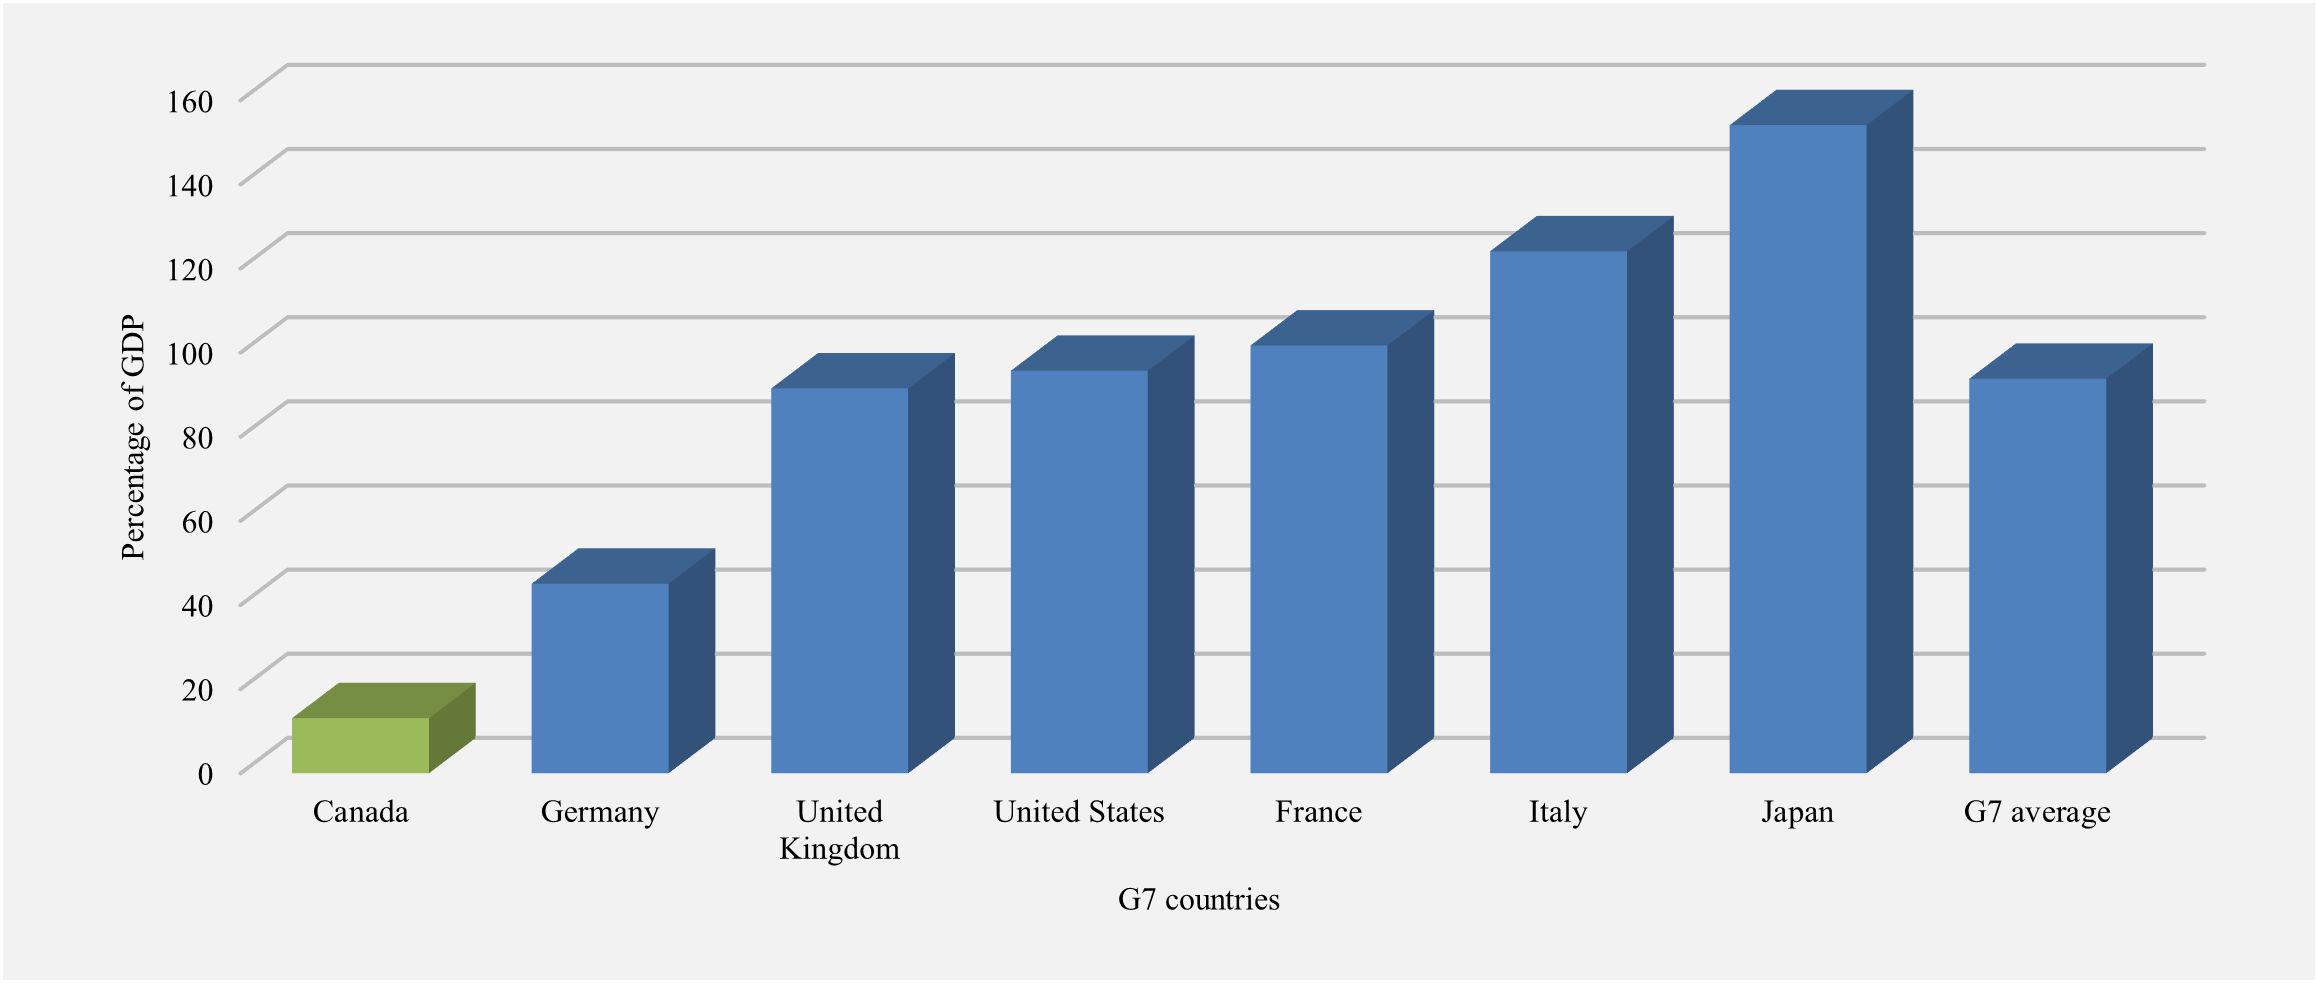
Image description
| Country | Percentage |
|---|---|
| Canada | 13.1 |
| Germany | 45.1 |
| United Kingdom | 91.5 |
| United States | 95.7 |
| France | 101.7 |
| Italy | 124.1 |
| Japan | 154.1 |
| G7 average | 93.8 |
Canada's total government net debt-to-GDP ratio stood at 13.1% in 2023, according to the IMF. This is the lowest level among G7 countries, which the IMF estimates will record an average net debt of 93.8% of GDP in that same year.
International organizations such as the IMF and the Organisation for Economic Co-operation and Development publish figures for both gross debt (equivalent to total financial liabilities) and net debt (total financial liabilities less financial assets). When assessing the overall government fiscal situation, net debt is the preferred measure as it better reflects a country's financial position by accounting for both what it owes and what it has set aside. In particular, the net debt measure recognizes that public investments in financial assets generate future revenues or have been specifically accumulated to offset current or future liabilities. This is particularly relevant in Canada's case given its sizable financial asset holdings. In particular, Canada has taken significant steps to fund its public pensions, mitigating future fiscal risks. The CPP alone had over $630 billion in net assets as of March 31, 2024, ensuring the plan is actuarially sound for Canadians for at least the next 75 years. These and other financial assets should be taken into account when assessing the country's financial situation—especially when making comparisons to peer countries that have not accumulated as many financial assets, including those to meet future public pension liabilities.
The following table provides a reconciliation between the Government of Canada's accumulated deficit-to-GDP ratio and Canada's total government net debt-to-GDP ratio used for international net debt comparison purposes. Importantly, the latter includes the net debt of the federal, provincial, territorial, and local governments, as well as the net assets held by the CPP and QPP and excludes liabilities for public sector pensions and other employee future benefits. Given significant inconsistencies across countries in the accounting treatment of unfunded liabilities for public sector pensions and other employee future benefits, international organizations remove them from debt estimates for countries that proactively include them (such as Canada) to facilitate international comparability.
| (% of GDP) | |
|---|---|
| Accumulated deficit | 42.1 |
| Add: Non-financial assets | 4.0 |
| Net debt (Public Accounts basis) | 46.1 |
| Less: | |
| Liabilities for public sector pensions | (negative 5.6) |
| Liabilities for other future benefits | (negative 6.7) |
| National Accounts/Public Accounts methodological differences and timing adjustmentsLinks to footnote 1 in table 28 | (negative 8.0) |
| Total federal net debt (National Accounts basis) | 25.7 |
| Add: Net debt of provincial/territorial and local governments | 11.6 |
| Less: Net assets of the CPP/QPP | (negative 24.4) |
| Total government net debtLinks to footnote 2 in table 28 | 12.9 |
Non-financial assets
Non-financial assets include the net book value of the government's tangible capital assets, which include land, buildings, works and infrastructure such as roads and bridges, machinery and equipment, ships, aircraft, and other vehicles. Non-financial assets also include inventories and prepaid expenses and other.
Non-financial assets by category for 2024
Note: Numbers may not add to 100% due to rounding.
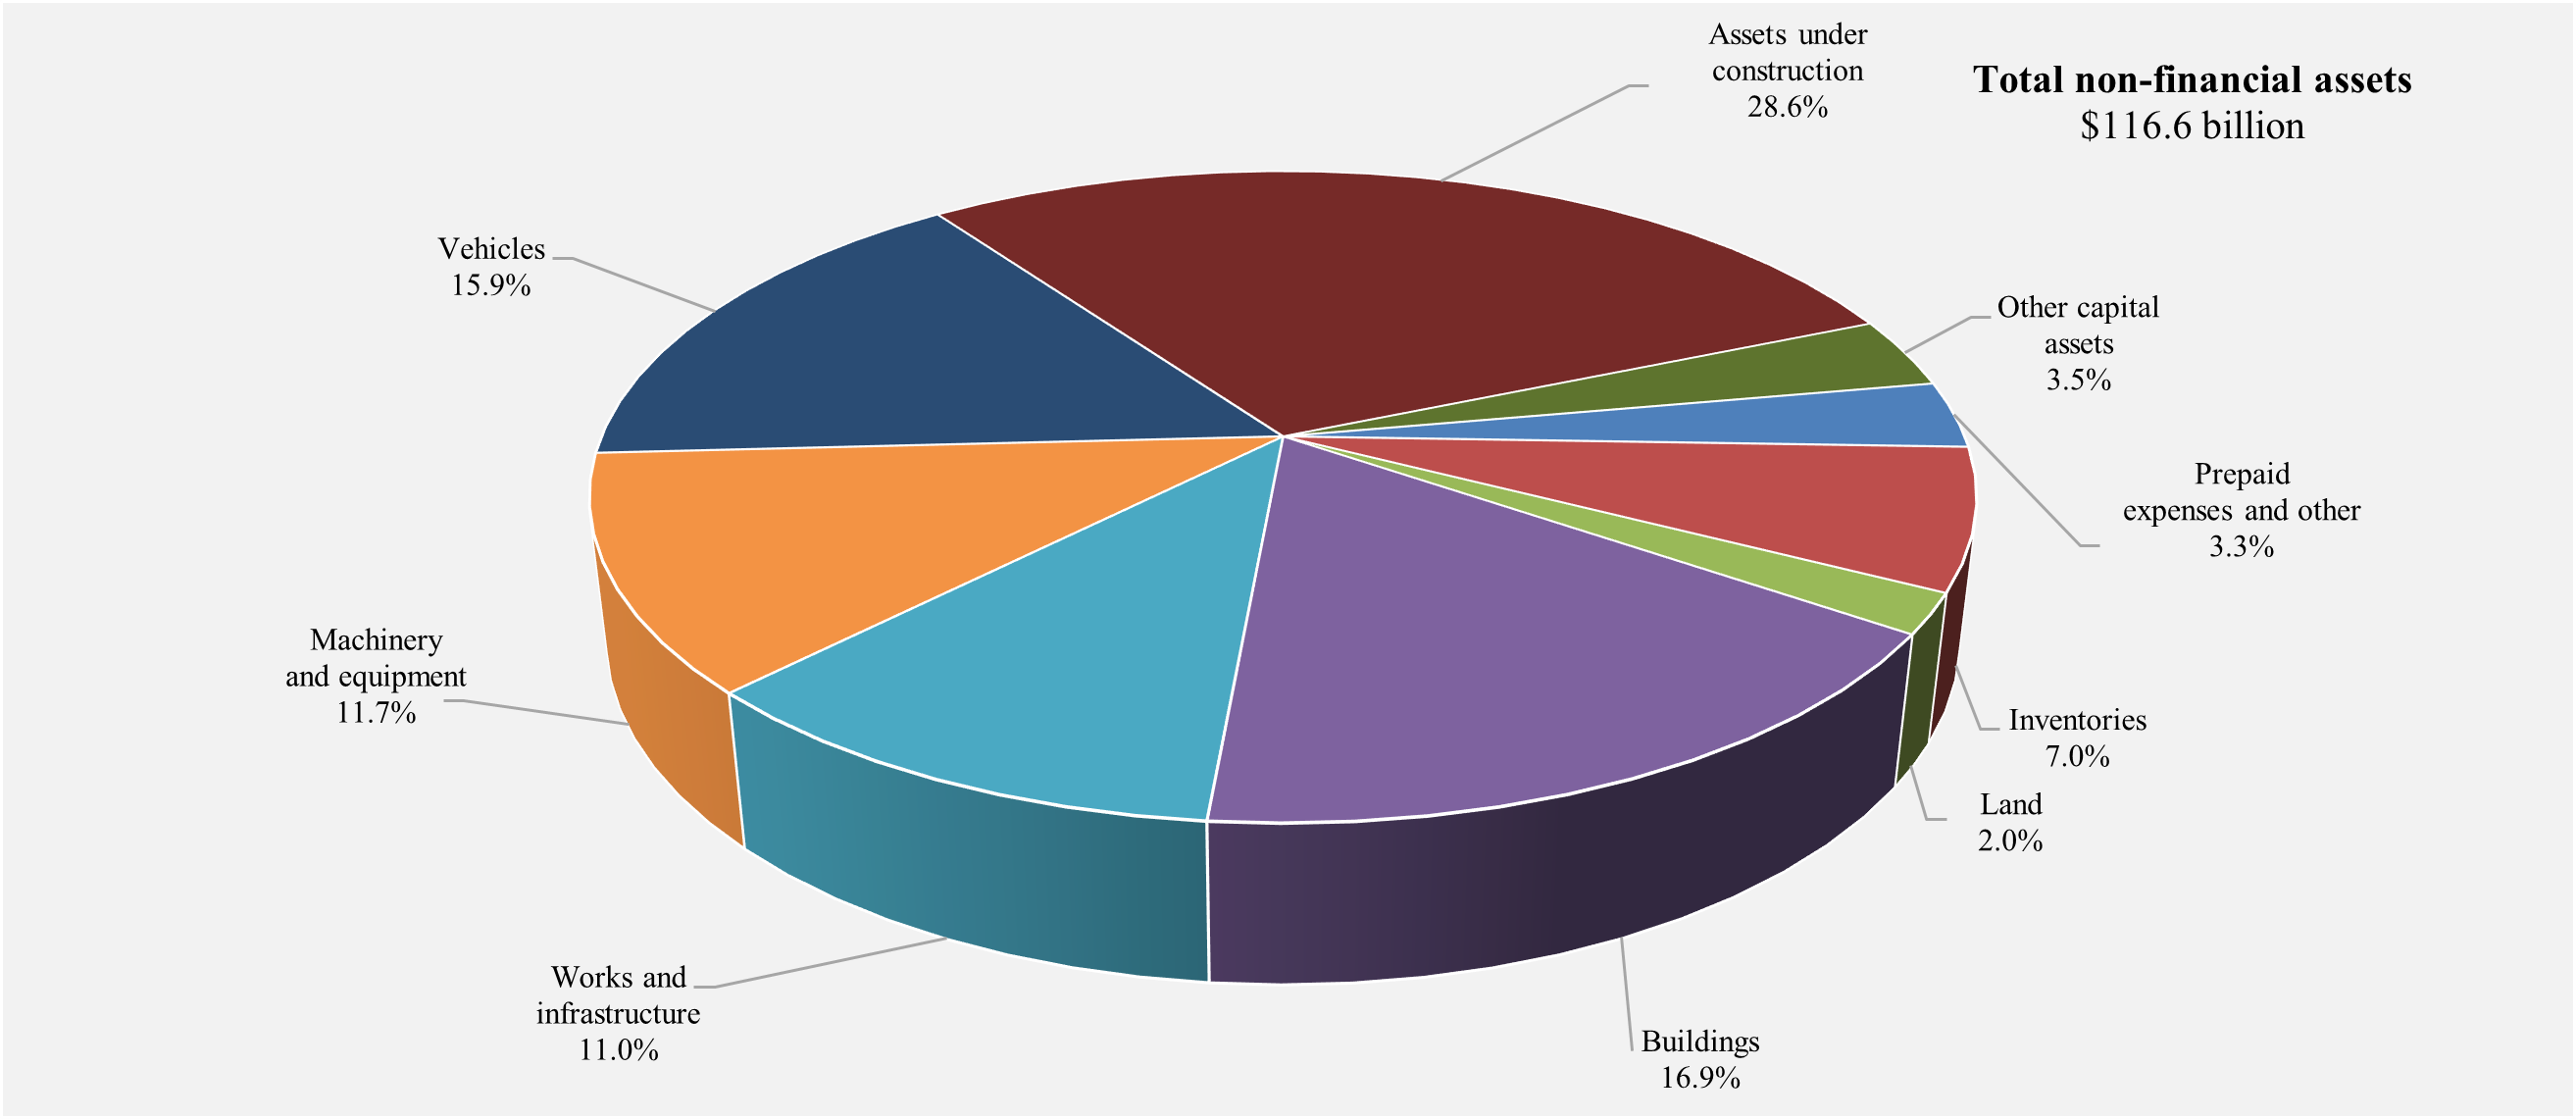
Image description
| Non-financial assets | Percentage |
|---|---|
| Prepaid expenses and other | 3.3% |
| Inventories | 7% |
| Land | 2% |
| Buildings | 16.9% |
| Works and infrastructure | 11% |
| Machinery and equipment | 11.7% |
| Vehicles | 15.9% |
| Assets under construction | 28.6% |
| Other capital assets | 3.5% |
At March 31, 2024, non-financial assets stood at $116.6 billion, up $6.9 billion from a year earlier. This growth primarily relates to a $7.2-billion increase in tangible capital assets, in large part reflecting an increase in assets under construction. Prepaid expenses and other increased $0.8 billion, largely due to defence and vaccine prepayments, while inventories decreased $1.2 billion, primarily due to the revaluation of inventories.
At March 31, 2024, 61.1% of the original cost of the government's depreciable tangible capital assets had been amortized, an increase of 0.3% from a year earlier. Depreciable tangible capital assets exclude land and assets under construction, which are not yet available for use.
Tangible capital assets
Note: The amounts for 2022 were restated in 2023 to reflect the government’s adoption of the new Public Sector Accounting Standard PS 3280 Asset Retirement Obligations. Prior years’ amounts have not been restated.
(in billions of dollars)
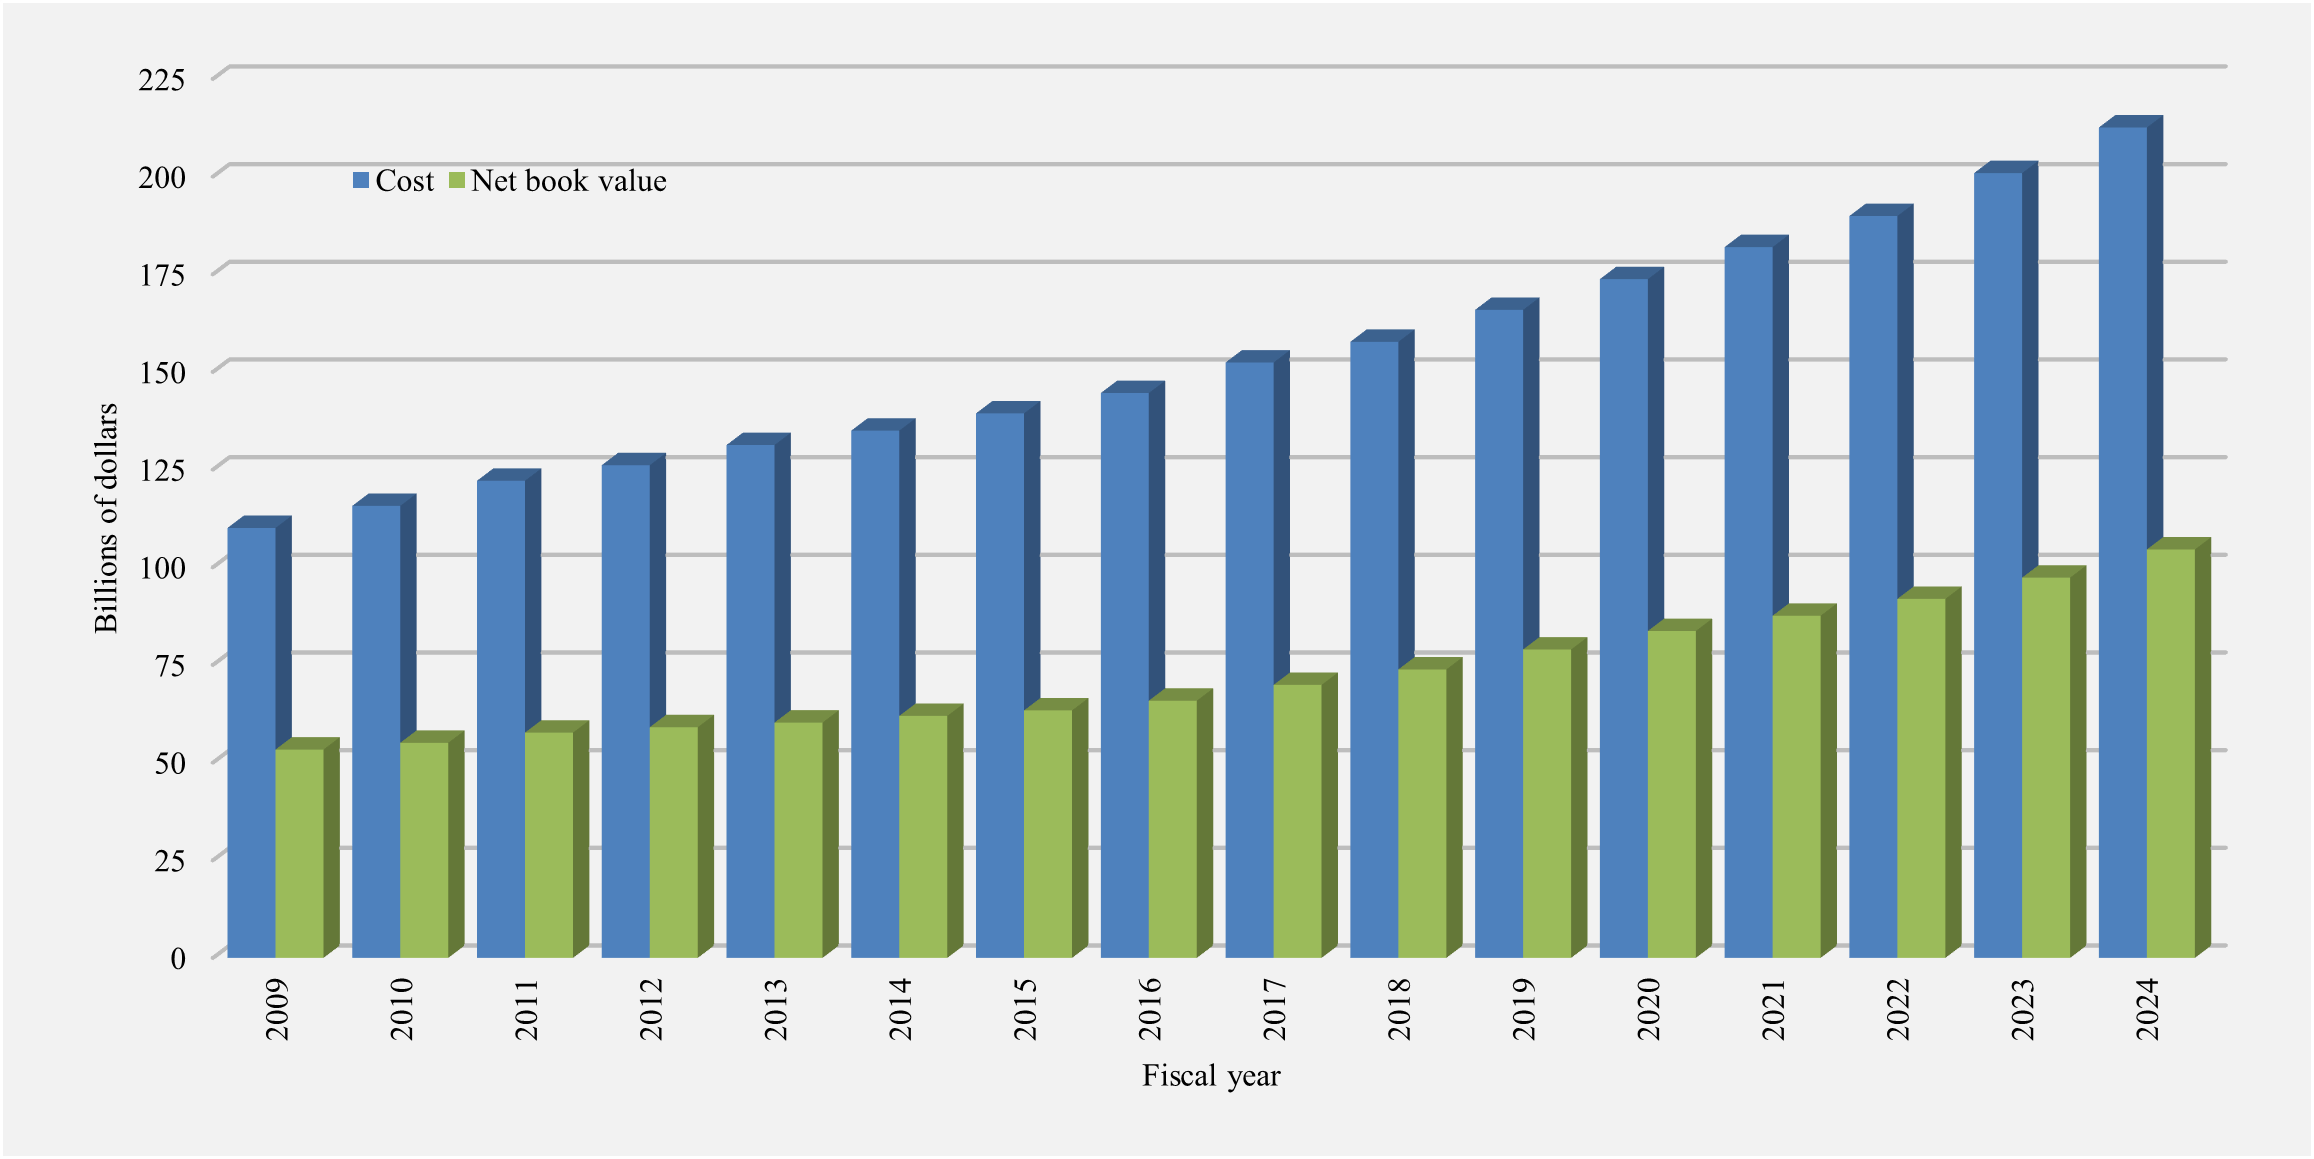
Image description
| Fiscal year | Cost | Net Book Value |
|---|---|---|
| 2009 | 110.1 | 53.3 |
| 2010 | 115.7 | 55.1 |
| 2011 | 122.1 | 57.7 |
| 2012 | 126.1 | 59.0 |
| 2013 | 131.3 | 60.2 |
| 2014 | 135.0 | 61.9 |
| 2015 | 139.4 | 63.3 |
| 2016 | 144.6 | 65.8 |
| 2017 | 152.4 | 69.9 |
| 2018 | 157.7 | 73.8 |
| 2019 | 165.9 | 78.9 |
| 2020 | 173.7 | 83.7 |
| 2021 | 182.0 | 87.6 |
| 2022 | 189.9 | 91.9 |
| 2023 | 200.9 | 97.3 |
| 2024 | 212.6 | 104.6 |
Assets under construction totalled $33.4 billion at March 31, 2024, some of which are being built using public-private partnerships in which the private sector partner designs, builds, finances, and/or operates and maintains large infrastructure projects. The government's liability for these long-term financing arrangements is included in obligations under public-private partnerships reported in Note 11 of the consolidated financial statements.
The government has a robust policy framework for the management of assets and acquired services. The framework sets the direction for management of assets to ensure the conduct of activities provides value for money and demonstrates sound stewardship in program delivery.
Cash flow
The annual operating surplus or deficit is presented on an accrual basis of accounting, recognizing revenue in the period it is earned and expenses when incurred, regardless of when the associated cash is received or paid. In contrast, the government's net cash flow measures the difference between cash coming in to the government and cash going out.
In 2024, the government had a total cash requirement of $70.9 billion before financing activities, compared to a total cash requirement of $54.2 billion before financing activities in 2023. Operating activities resulted in a net cash requirement of $47.0 billion in 2024, compared to a net cash requirement of $24.4 billion in 2023, reflecting a number of factors including payments made under claims settlements during the year, the largest being the $23.3-billion payment under the final settlement agreement for First Nations Child and Family Services. Cash used by capital investment activities resulted in a net cash requirement of $13.5 billion in 2024, compared to a net cash requirement of $10.9 billion in 2023. Investing activities resulted in a net cash outflow of $10.5 billion in 2024, compared to a net cash outflow of $18.9 billion in 2023, reflecting in part the repayment of CEBA loans during 2024.
| 2024 | 2023 RestatedLinks to footnote 1 in table 31 |
|
|---|---|---|
| Cash used by operating activities | (negative 46,950) | (negative 24,353) |
| Cash used by capital investment activities | (negative 13,498) | (negative 10,865) |
| Cash used by investing activities | (negative 10,478) | (negative 18,940) |
| Total cash used before financing activities | (negative 70,926) | (negative 54,158) |
| Cash provided by financing activities | 96,979 | 2,342 |
| Net (decrease) increase in cash and cash equivalents | 26,053 | (negative 51,816) |
| Cash and cash equivalents at beginning of year | 49,006 | 100,822 |
| Cash and cash equivalents at end of year | 75,059 | 49,006 |
Financing activities generated a $97.0-billion source of cash in 2024, resulting in an overall net increase in cash of $26.1 billion. The level of cash and cash equivalents stood at $75.1 billion at March 31, 2024.
Contractual obligations and contractual rights
The nature of the government's operations results in large multi-year contracts and agreements that will become expenses, liabilities, and cash outflows in future years. Major contractual obligations of the government relate to transfer payments, capital assets and purchases, operating leases, and payments to international organizations. As of March 31, 2024, future payments under contractual obligations totalled $257.1 billion ($236.5 billion as of March 31, 2023). The increase over the prior year largely reflects increased contractual obligations related to capital assets and purchases.
Similarly, the activities of government can also involve the negotiation of contracts or agreements with third parties that result in the government having rights to both assets and revenues in the future. These arrangements typically relate to sales of goods and services, leases of property, and royalties and profit-sharing arrangements. The terms of these contracts and agreements may not always allow for a reasonable estimate of revenues in the future. For contracts and agreements that do allow for a reasonable estimate, total revenues to be received in the future under major contractual rights are estimated at $35.6 billion at March 31, 2024 ($30.9 billion as of March 31, 2023).
Further details regarding the government's contractual obligations and contractual rights are provided in Section 11, Contractual obligations, contractual rights and contingent liabilities, of this volume.
Risks and uncertainties
The government's financial results are subject to risks and uncertainties inherent in the nature of certain financial statement elements and government operations, including:
- changes in economic conditions–particularly changes in economic growth, inflation and interest rates
- outcomes from litigation, arbitration and negotiations with third parties, and the resolution of taxes under objection
- identification and quantification of environmental liabilities
- aging tangible capital assets, including information technology infrastructure, and costs associated with retiring capital assets at the end of their useful lives
- credit risk and foreign currency risk associated with the government's financial assets, including loans, investments and advances and foreign exchange accounts assets
- unforeseen situations such as natural catastrophes, geopolitical developments, cybersecurity incidents, or pandemics
- effects of climate change and climate-related innovations and measures, which could affect the values of existing assets and liabilities.
The government's financial statements incorporate a number of significant estimates and assumptions related to risks and uncertainties that are used in valuing its assets, liabilities, revenues, and expenses. One of the most significant areas of measurement uncertainty relates to public sector pensions and other employee and veteran future benefits, for which payments are made many years into the future and are dependent upon the evolution of factors such as wage increases, inflation, workforce composition, retirement rates, mortality rates, and returns on pension investments. In developing its best estimates and assumptions, which are set at the reporting date, the government takes into consideration historical experience, current facts and circumstances, and expected future developments. The government's financial results are also subject to volatility as a result of year-over-year changes in the discount rates used to value its public sector pension and other employee and veteran future benefit obligations. These discount rates are affected by interest rates and expected rates of return on assets, and changes in these discount rates will result in unrealized gains and losses that are amortized to expenses.
Another significant area of measurement uncertainty relates to contingent liabilities. Contingent liabilities represent possible obligations that may result in future payments when one or more events occur or fail to occur. Examples of contingent liabilities include loan guarantees; insurance programs, including the Deposit Insurance Fund operated by the Canada Deposit Insurance Corporation and the Mortgage Insurance Fund operated by CMHC; callable share capital in international financial institutions; and claims and pending and threatened litigation. This last category includes, among other items, specific claims that deal with the past grievances of First Nations related to Canada's obligations under historic treaties or the way it managed First Nations' funds or other assets, and comprehensive land claims, which relate to areas of the country where Aboriginal rights and title have not been resolved by treaty or by other legal means. As of March 31, 2024, the government's exposure to contingent liabilities totalled over $2 trillion. However, the vast majority of this amount represents situations where the probability of a future payment is assessed as unlikely or not determinable. The government records a provision for contingent liabilities only in cases where the probability of future payment is considered likely and the amount is estimable. As of March 31, 2024, this provision totalled $56.6 billion. However, as highlighted, there is inherent uncertainty in this amount.
The government's assumptions related to risks and uncertainties used in determining its financial results are reassessed at each fiscal year-end and updated as necessary. Exposure to measurement uncertainty from the use of accounting and other estimates in recording certain transactions is discussed in the notes to the consolidated financial statements, including Note 1 (Summary of significant accounting policies). Details with respect to the measurement of specific financial statement elements, such as tax revenues (Note 4), provisions for accounts receivable (Note 16 and Note 17), contingent liabilities (Note 9), environmental liabilities and asset retirement obligations (Note 10), public sector pensions and other employee and veteran future benefits (Note 12), and loans, investments and advances (Note 19 and Note 20) are also included in the consolidated financial statements. Note 22 of the consolidated financial statements provides information on instruments and strategies used by the government to manage financial risks associated with its financial assets and liabilities.
The government's revenues and expenses are highly sensitive to changes in economic conditions—particularly to changes in economic growth, inflation, and interest rates.
To illustrate the impact of changes in economic conditions, the Department of Finance Canada publishes, on a regular basis, sensitivity impacts on the budgetary balance. These are "rules of thumb" as the actual impact will depend on many other factors as well. As published in the April 16, 2024, federal budget, these show, for example, that:
- A one-year, 1-percentage-point decrease in real GDP growth would lower the budgetary balance by $4.9 billion in the first year, $4.8 billion in the second year, and $5.6 billion in the fifth year.
- A one-year, 1-percentage-point decrease in GDP inflation would lower the budgetary balance by $2.3 billion in the first year, $2.6 billion in the second year, and $1.9 billion in the fifth year, assuming that the Consumer Price Index moves in line with GDP inflation.
- A sustained 100-basis-point increase in interest rates would lower the budgetary balance by $3.7 billion in the first year, $5.5 billion in the second year, and $7.7 billion in the fifth year.
While these generalized rules of thumb provide good estimates of the sensitivity of the budgetary balance to small economic changes, it is important to note that some of the estimated relationships would change in response to large economic changes.
Public Accounts of Canada 2024 Volume I—Bottom of the page Navigation
- Previous page: Section 1: Financial statements discussion and analysis
- Section 1: Table of contents: Section 1: Financial statements discussion and analysis
- Next page: Ten-year comparative financial information
- Date modified: