

Government of Canada media expenditures with the Agency of Record: 2019 to 2020 Annual Report on Government of Canada Advertising Activities
This section provides information on media expenditures for all placement made through the Agency of Record (AOR) on behalf of Government of Canada (GC) institutions. In the context of this report, “digital media” encompasses Internet tactics and “traditional media” encompasses television, radio, print and out-of-home. A breakdown of Internet media expenditures is provided in Figure 7. Amounts are net media costs paid to suppliers for advertising space and time. Fees paid to the AOR to perform the media placement, as well as media planning and creative production costs are excluded. The majority of GC media placement were made through the AOR (93%). More information on media expenditures for media placement made directly with media suppliers by GC institutions is provided in Table 4.
Note
Values are rounded to the nearest whole number. The sum of values may not add up exactly to the totals indicated due to rounding.
Figure 3: Media expenditures by media type over 5 years

Image description
This vertical bar graphic presents total media expenditures and the amounts spent by media type over five years, from fiscal year 2015 to 2016 to fiscal year 2019 to 2020. The media types are: Internet, television, out-of-home, print and radio. The graphic is for illustration purposes and doesn’t include the specific amounts spent, which are provided in the table under the graphic.
| Media | 2015 to 2016 $30.27 million |
2016 to 2017 $30.63 million |
2017 to 2018 $27.76 million |
2018 to 2019 $43.04 million |
2019 to 2020 $44.86 million |
|---|---|---|---|---|---|
| Internet | $10,324,095 | $16,769,519 | $18,153,526 | $22,927,081 | $24,711,751 |
| Television | $15,290,363 | $6,377,972 | $4,470,942 | $13,575,701 | $11,737,577 |
| Out-of-home | $886,687 | $1,928,330 | $4,177,134 | $2,818,896 | $3,671,456 |
| $2,131,466 | $2,938,610 | $570,196 | $2,921,078 | $2,385,990 | |
| Radio | $1,636,430 | $2,618,111 | $391,916 | $799,671 | $2,352,370 |
| Total | $30,269,041 | $30,632,543 | $27,763,715 | $43,042,428 | $44,859,145 |
Figure 4: Distribution of media expenditures by media type over 5 years

Image description
This vertical bar graphic presents the percentage distribution of total media expenditures by media type over five years, from fiscal year 2015 to 2016 to fiscal year 2019 to 2020. The media types are: Internet, television, out-of-home, print and radio. The information indicated in the graphic is the following:
| Media | 2015 to 2016 $30.27 million |
2016 to 2017 $30.63 million |
2017 to 2018 $27.76 million |
2018 to 2019 $43.04 million |
2019 to 2020 $44.86 million |
|---|---|---|---|---|---|
| Internet | 34% | 55% | 65% | 53% | 55% |
| Television | 51% | 21% | 16% | 32% | 26% |
| Out-of-home | 3% | 6% | 15% | 7% | 8% |
| 7% | 10% | 2% | 7% | 5% | |
| Radio | 5% | 9% | 1% | 2% | 5% |
| Total | 100% | 100% | 100% | 100% | 100% |
Figure 5: Media expenditures by quarter over 5 years

Image description
This vertical bar graphic presents total media expenditures and the amounts spent by fiscal year quarter in millions of dollars over five years, from fiscal year 2015 to 2016 to fiscal year 2019 to 2020. The fiscal year quarters are: April to June (Q1), July to September (Q2), October to December (Q3) and January to March (Q4). The graphic is for illustration purposes and doesn’t include the specific amounts spent, which are provided in the table under the graphic.
| Fiscal year quarter | 2015 to 2016 $30.27 million |
2016 to 2017 $30.63 million |
2017 to 2018 $27.76 million |
2018 to 2019 $43.04 million |
2019 to 2020 $44.86 million |
|---|---|---|---|---|---|
| April to June (Q1) | $11,334,752 | $9,707,078 | $2,024,184 | $2,991,500 | $31,189,476 |
| July to September (Q2) | $10,173,674 | $297,333 | $2,412,338 | $3,051,747 | $277,813 |
| October to December (Q3) | $2,779,671 | $3,014,958 | $7,353,217 | $15,346,757 | $2,808,375 |
| January to March (Q4) | $5,980,945 | $17,613,174 | $15,973,975 | $21,652,423 | $10,583,481 |
| Total | $30,269,041 | $30,632,543 | $27,763,715 | $43,042,428 | $44,859,145 |
Figure 6: Distribution of media expenditures by quarter over 5 years
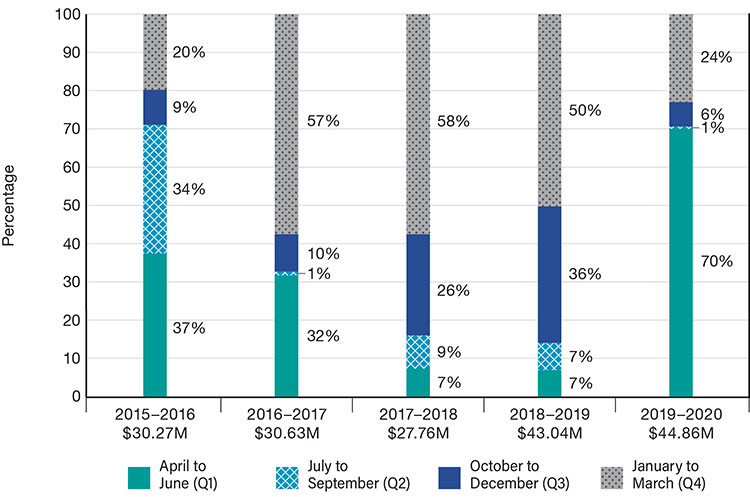
Image description
This vertical bar graphic presents the percentage distribution of total media expenditures by fiscal year quarter over five years, from fiscal year 2015 to 2016 to fiscal year 2019 to 2020. The fiscal year quarters are: April to June (Q1), July to September (Q2), October to December (Q3) and January to March (Q4). The information indicated in the graphic is the following:
| Fiscal year quarter | 2015 to 2016 $30.27 million |
2016 to 2017 $30.63 million |
2017 to 2018 $27.76 million |
2018 to 2019 $43.04 million |
2019 to 2020 $44.86 million |
|---|---|---|---|---|---|
| April to June (Q1) | 37% | 32% | 7% | 7% | 70% |
| July to September (Q2) | 34% | 1% | 9% | 7% | 1% |
| October to December (Q3) | 9% | 10% | 26% | 36% | 6% |
| January to March (Q4) | 20% | 57% | 58% | 50% | 24% |
| Total | 100% | 100% | 100% | 100% | 100% |
Figure 7: Digital media expenditures by media type over 5 years
Search engine marketing media placement was made with two platforms. The largest share was allocated to Google receiving 93% ($4.27 million) of total media expenditures in this medium. The remaining 7% ($305 thousand) was spent with Bing. A breakdown by platform is also provided for social media in Figure 9 (media expenditures by platform) and Figure 10 (distribution by platform). The term “real-time bidding” used in previous annual reports has been replaced with the term “programmatic”, which better reflects today’s environment and simply means media placement executed using technology to perform the transactions virtually in real-time.

Image description
This vertical bar graphic presents total digital media expenditures and the amounts spent by media type in millions of dollars over five years, from fiscal year 2015 to 2016 to fiscal year 2019 to 2020. The digital media types are: display non-programmatic, social media, search engine marketing and display programmatic. The graphic is for illustration purposes and doesn’t include the specific amounts spent, which are provided in table under the graphic.
| Digital media | 2015 to 2016 $10.32 million |
2016 to 2017 $16.77 million |
2017 to 2018 $18.15 million |
2018 to 2019 $22.93 million |
2019 to 2020 $24.71 million |
|---|---|---|---|---|---|
| Display non-programmatic | $6,276,943 | $5,986,980 | $7,064,404 | $10,134,089 | $9,624,895 |
| Social media | $2,032,632 | $7,125,264 | $7,755,521 | $7,617,926 | $8,561,088 |
| Search engine marketing | $1,480,420 | $2,124,167 | $2,258,743 | $4,739,636 | $4,570,668 |
| Display programmatic | $534,100 | $1,533,108 | $1,074,858 | $435,430 | $1,955,100 |
| Total | $10,324,095 | $16,769,519 | $18,153,526 | $22,927,081 | $24,711,751 |
Figure 8: Distribution of digital media expenditures by media type over 5 years
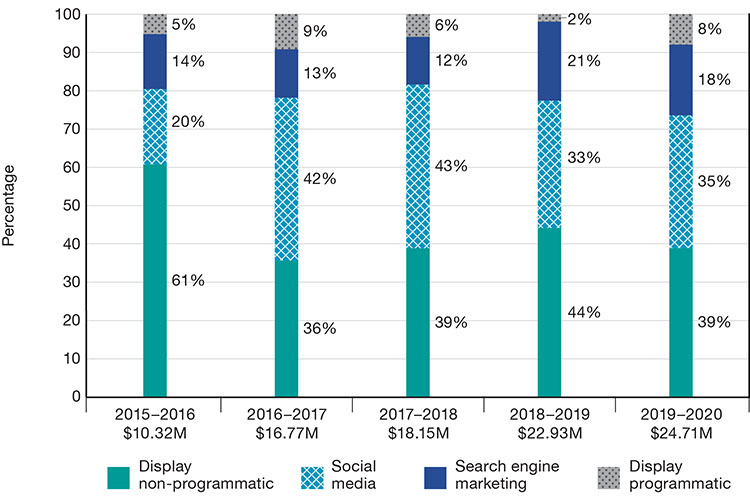
Image description
This vertical bar graphic presents the percentage distribution of total digital media expenditures by media type over five years, from fiscal year 2015 to 2016 to fiscal year 2019 to 2020. The digital media types are: display non-programmatic, social media, search engine marketing and display programmatic. The information indicated in the graphic is the following:
| Digital media | 2015 to 2016 $10.32 million |
2016 to 2017 $16.77 million |
2017 to 2018 $18.15 million |
2018 to 2019 $22.93 million |
2019 to 2020 $24.71 million |
|---|---|---|---|---|---|
| Display non-programmatic | 61% | 36% | 39% | 44% | 39% |
| Social media | 20% | 42% | 43% | 33% | 35% |
| Search engine marketing | 14% | 13% | 12% | 21% | 18% |
| Display programmatic | 5% | 9% | 6% | 2% | 8% |
| Total | 100% | 100% | 100% | 100% | 100% |
Figure 9: Social media expenditures over 5 years

Image description
This vertical bar graphic presents total social media expenditures and the amounts spent by platform in millions of dollars over five years, from fiscal year 2015 to 2016 to fiscal year 2019 to 2020. The social media platforms are: Facebook/Instagram, Twitter, Snapchat and LinkedIn. The graphic is for illustration purposes and doesn’t include the specific amounts spent, which are provided in the table under the graphic.
| Platform | 2015 to 2016 $2.03 million |
2016 to 2017 $7.13 million |
2017 to 2018 $7.76 million |
2018 to 2019 $7.62 million |
2019 to 2020 $8.56 million |
|---|---|---|---|---|---|
| Facebook/Instagram | $1,336,973 | $4,646,517 | $5,684,613 | $5,399,912 | $5,854,469 |
| $587,845 | $1,942,452 | $941,505 | $839,447 | $1,119,479 | |
| Snapchat | $0 | $0 | $406,845 | $565,814 | $920,635 |
| $107,814 | $536,295 | $722,559 | $812,753 | $666,505 | |
| Total | $2,032,632 | $7,125,264 | $7,755,521 | $7,617,926 | $8,561,088 |
Figure 10: Distribution of social media expenditures over 5 years

Image description
This vertical bar graphic presents the percentage distribution of total social media expenditures by platform over five years, from fiscal year 2015 to 2016 to fiscal year 2019 to 2020. The social media platforms are: Facebook/Instagram, Twitter, Snapchat and LinkedIn. The information indicated in the graphic is the following:
| Platform | 2015 to 2016 $2.03 million |
2016 to 2017 $7.13 million |
2017 to 2018 $7.76 million |
2018 to 2019 $7.62 million |
2019 to 2020 $8.56 million |
|---|---|---|---|---|---|
| Facebook/Instagram | 66% | 65% | 73% | 71% | 68% |
| 29% | 27% | 12% | 11% | 13% | |
| Snapchat | 0% | 0% | 5% | 7% | 11% |
| 5% | 8% | 9% | 11% | 8% | |
| Total | 100% | 100% | 100% | 100% | 100% |
Table 1: English and French media expenditures by media type
Reaching Canadians in the official language of their choice, regardless of where they reside, is a mandatory requirement for GC advertising. All media plans are developed, reviewed and approved in accordance with this requirement.
Amounts below include all media placement within Canada during fiscal year 2019 to 2020. Attribution of media expenditures by official language is based on the following:
- Internet: The language of the ads
- Television and Radio: The broadcast language of the stations
- Out-of-home: The predominant language of each province, except for cinema, which is based on the proportion of screens in each language of each province
- Print: The language in which the publication is published
| Media | English | French | Total | ||
|---|---|---|---|---|---|
| Expenditures | Distribution | Expenditures | Distribution | ||
| Internet | $17,637,757 | 77% | $5,391,076 | 23% | $23,028,833 |
| Television | $9,742,419 | 84% | $1,826,581 | 16% | $11,569,000 |
| Out-of-home | $2,795,662 | 76% | $875,795 | 24% | $3,671,456 |
| Radio | $1,726,553 | 85% | $305,817 | 15% | $2,032,370 |
| $1,261,059 | 78% | $361,915 | 22% | $1,622,974 | |
| Total | $33,163,449 | 79% | $8,761,184 | 21% | $41,924,633 |
Table 2: Media expenditures in ethnic and Indigenous media by media type
In addition to media placement required to fulfil official languages obligations, ethnic and Indigenous media are also used to reach those audiences.
Amounts below include all media placement within Canada during fiscal year 2019 to 2020. Ethnic and Indigenous media are multilingual and can include advertisements in various languages as well as English and French.
| Media | Ethnic | Indigenous | Total | ||
|---|---|---|---|---|---|
| Expenditures | Distribution | Expenditures | Distribution | ||
| Internet | $417,372 | 46% | $582,975 | 66% | $1,000,348 |
| $337,394 | 37% | $43,671 | 5% | $381,064 | |
| Radio | $45,880 | 5% | $198,879 | 23% | $244,759 |
| Television | $115,409 | 13% | $53,168 | 6% | $168,577 |
| Total | $916,056 | 100% | $878,693 | 100% | $1,794,748 |
Table 3: Media expenditures targeting international audiences by media type
During fiscal year 2019 to 2020, media placement was made by the AOR for Global Affairs Canada, and Immigration, Refugees and Citizenship Canada, to reach potential newcomers to Canada. This can include advertisements in various languages as well as English in French.
| Media | Expenditures | Distribution |
|---|---|---|
| Internet | $682,570 | 60% |
| $381,952 | 34% | |
| Radio | $75,241 | 7% |
| Total | $1,139,764 | 100% |
Figure 11: COVID-19 media expenditures by media type
Figures 11 and 12 below provide information on COVID-19 national advertising in fiscal year 2019 to 2020 (ending March 31, 2020). This has been compiled for this annual report on an exceptional basis, because the situation with the pandemic is unique and historic.

Image description
This segmented pie graphic presents total media expenditures on COVID-19 national advertising in millions of dollars, and the amounts spent and percentage distribution by media type. The media types are: television, radio, Internet and print. Expenditures and percentage distribution are presented next to each pie segment. In the center of the pie is the total amount spent on COVID-19 media placement in fiscal year 2019 to 2020. The information indicated in the graphic is the following:
| Media | Expenditures | Distribution |
|---|---|---|
| Television | $1,915,751 | 43% |
| Radio | $1,288,613 | 29% |
| Internet | $856,825 | 19% |
| $433,522 | 10% | |
| Total | $4,494,710 | 100% |
Figure 12: COVID-19 digital media expenditures by media type

Image description
This segmented pie graphic presents total digital media expenditures on COVID-19 national advertising in millions of dollars, and the amounts spent and related percentage distribution by digital media type. The digital media types are: social media, search engine marketing, display programmatic and display non-programmatic. Expenditures and percentage distribution are presented next to each pie segment. In the center of the pie is the total amount spent on COVID-19 digital media placement in fiscal year 2019 to 2020. The information indicated in the graphic is the following:
| Digital media | Expenditures | Distribution |
|---|---|---|
| Social media | $176,998 | 21% |
| Search engine marketing | $145,467 | 17% |
| Display programmatic | $471,439 | 55% |
| Display non-programmatic | $62,921 | 7% |
| Total | $856,825 | 100% |
- Date modified: