

Government of Canada media expenditures with the Agency of Record: Annual Report on Government of Canada Advertising Activities 2020 to 2021
On this page
- Total media expenditures
- Figure 3: Media expenditures over 5 years
- Figure 4: Distribution of media expenditures over 5 years
- Figure 5: Media expenditures by media type over 5 years
- Figure 6: Distribution of media expenditures by media type over 5 years
- Figure 7: Traditional media expenditures over 5 years
- Figure 8: Distribution of traditional media expenditures over 5 years
- Figure 9: Digital media expenditures over 5 years
- Figure 10: Distribution of digital media expenditures over 5 years
- Figure 11: Social media expenditures over 5 years
- Figure 12: Distribution of social media expenditures over 5 years
- Figure 13: Media expenditures by quarter over 5 years
- Figure 14: Distribution of media expenditures by quarter over 5 years
- Official languages
- Ethnic and Indigenous media
- International audiences
- COVID-19
COVID-19
This section provides information on media expenditures for all media placement made through the Agency of Record (AOR) on behalf of Government of Canada (GC) institutions. Amounts are net media costs paid to suppliers for the purchase of advertising space and time. Fees paid to the AOR to perform the media placement, as well as media planning and creative production costs are excluded. The majority of the GC media placement was made through the AOR (98%). More information on media expenditures for media placement made directly with media suppliers by GC institutions is provided in table 10.
Note
Values are rounded to the nearest whole number. The sum of values may not add up exactly to the totals indicated due to rounding.
Total media expenditures
Figure 3: Media expenditures over 5 years

Image description
This vertical bar graphic presents an overview of total media expenditures in traditional and digital media, in millions of dollars over five years, from fiscal year 2016 to 2017 to fiscal year 2020 to 2021. The graphic is provided for illustration purposes. The information illustrated by the graphic is the following:
| Media | 2016 to 2017 | 2017 to 2018 | 2018 to 2019 | 2019 to 2020 | 2020 to 2021 |
|---|---|---|---|---|---|
| Traditional | $13,863,024 | $9,610,188 | $20,115,347 | $20,147,394 | $55,994,827 |
| Digital | $16,769,519 | $18,153,526 | $22,927,081 | $24,711,751 | $50,972,886 |
| Total | $30,632,543 | $27,763,715 | $43,042,428 | $44,859,145 | $106,967,712 |
Figure 4: Distribution of media expenditures over 5 years

Image description
This vertical bar graphic presents the percentage distribution of total media expenditures in traditional and digital media over five years, from fiscal year 2016 to 2017 to fiscal year 2020 to 2021. The graphic is provided for illustration purposes. The information illustrated by the graphic is the following:
| Media | 2016 to 2017 | 2017 to 2018 | 2018 to 2019 | 2019 to 2020 | 2020 to 2021 |
|---|---|---|---|---|---|
| Traditional | 45% | 35% | 47% | 45% | 52% |
| Digital | 55% | 65% | 53% | 55% | 48% |
| Total | 100% | 100% | 100% | 100% | 100% |
Figure 5: Media expenditures by media type over 5 years

Image description
This vertical bar graphic presents total media expenditures in traditional and digital media by media type in millions of dollars over five years, from fiscal year 2016 to 2017 to fiscal year 2020 to 2021. The traditional media types are television, radio, print and out-of-home. The digital media types are display programmatic, social media, search engine marketing and display non-programmatic. The graphic is provided for illustration purposes. The information illustrated by the graphic is the following:
| Media | 2016 to 2017 | 2017 to 2018 | 2018 to 2019 | 2019 to 2020 | 2020 to 2021 |
|---|---|---|---|---|---|
| Traditional | |||||
| Television | $6,377,972 | $4,470,942 | $13,575,701 | $11,737,577 | $30,125,369 |
| Radio | $2,618,111 | $391,916 | $799,671 | $2,352,370 | $11,590,073 |
| $2,938,610 | $570,196 | $2,921,078 | $2,385,990 | $9,312,472 | |
| Out-of-home | $1,928,330 | $4,177,134 | $2,818,896 | $3,671,456 | $4,966,913 |
| Digital | |||||
| Display programmatic | $1,533,108 | $1,074,858 | $435,430 | $1,955,100 | $21,144,891 |
| Social media | $7,125,264 | $7,755,521 | $7,617,926 | $8,561,088 | $19,905,460 |
| Search engine marketing | $2,124,167 | $2,258,743 | $4,739,636 | $4,570,668 | $5,883,032 |
| Display non-programmatic | $5,986,980 | $7,064,404 | $10,134,089 | $9,624,895 | $4,039,503 |
| Total | $30,632,543 | $27,763,715 | $43,042,428 | $44,859,145 | $106,967,712 |
Figure 6: Distribution of media expenditures by media type over 5 years
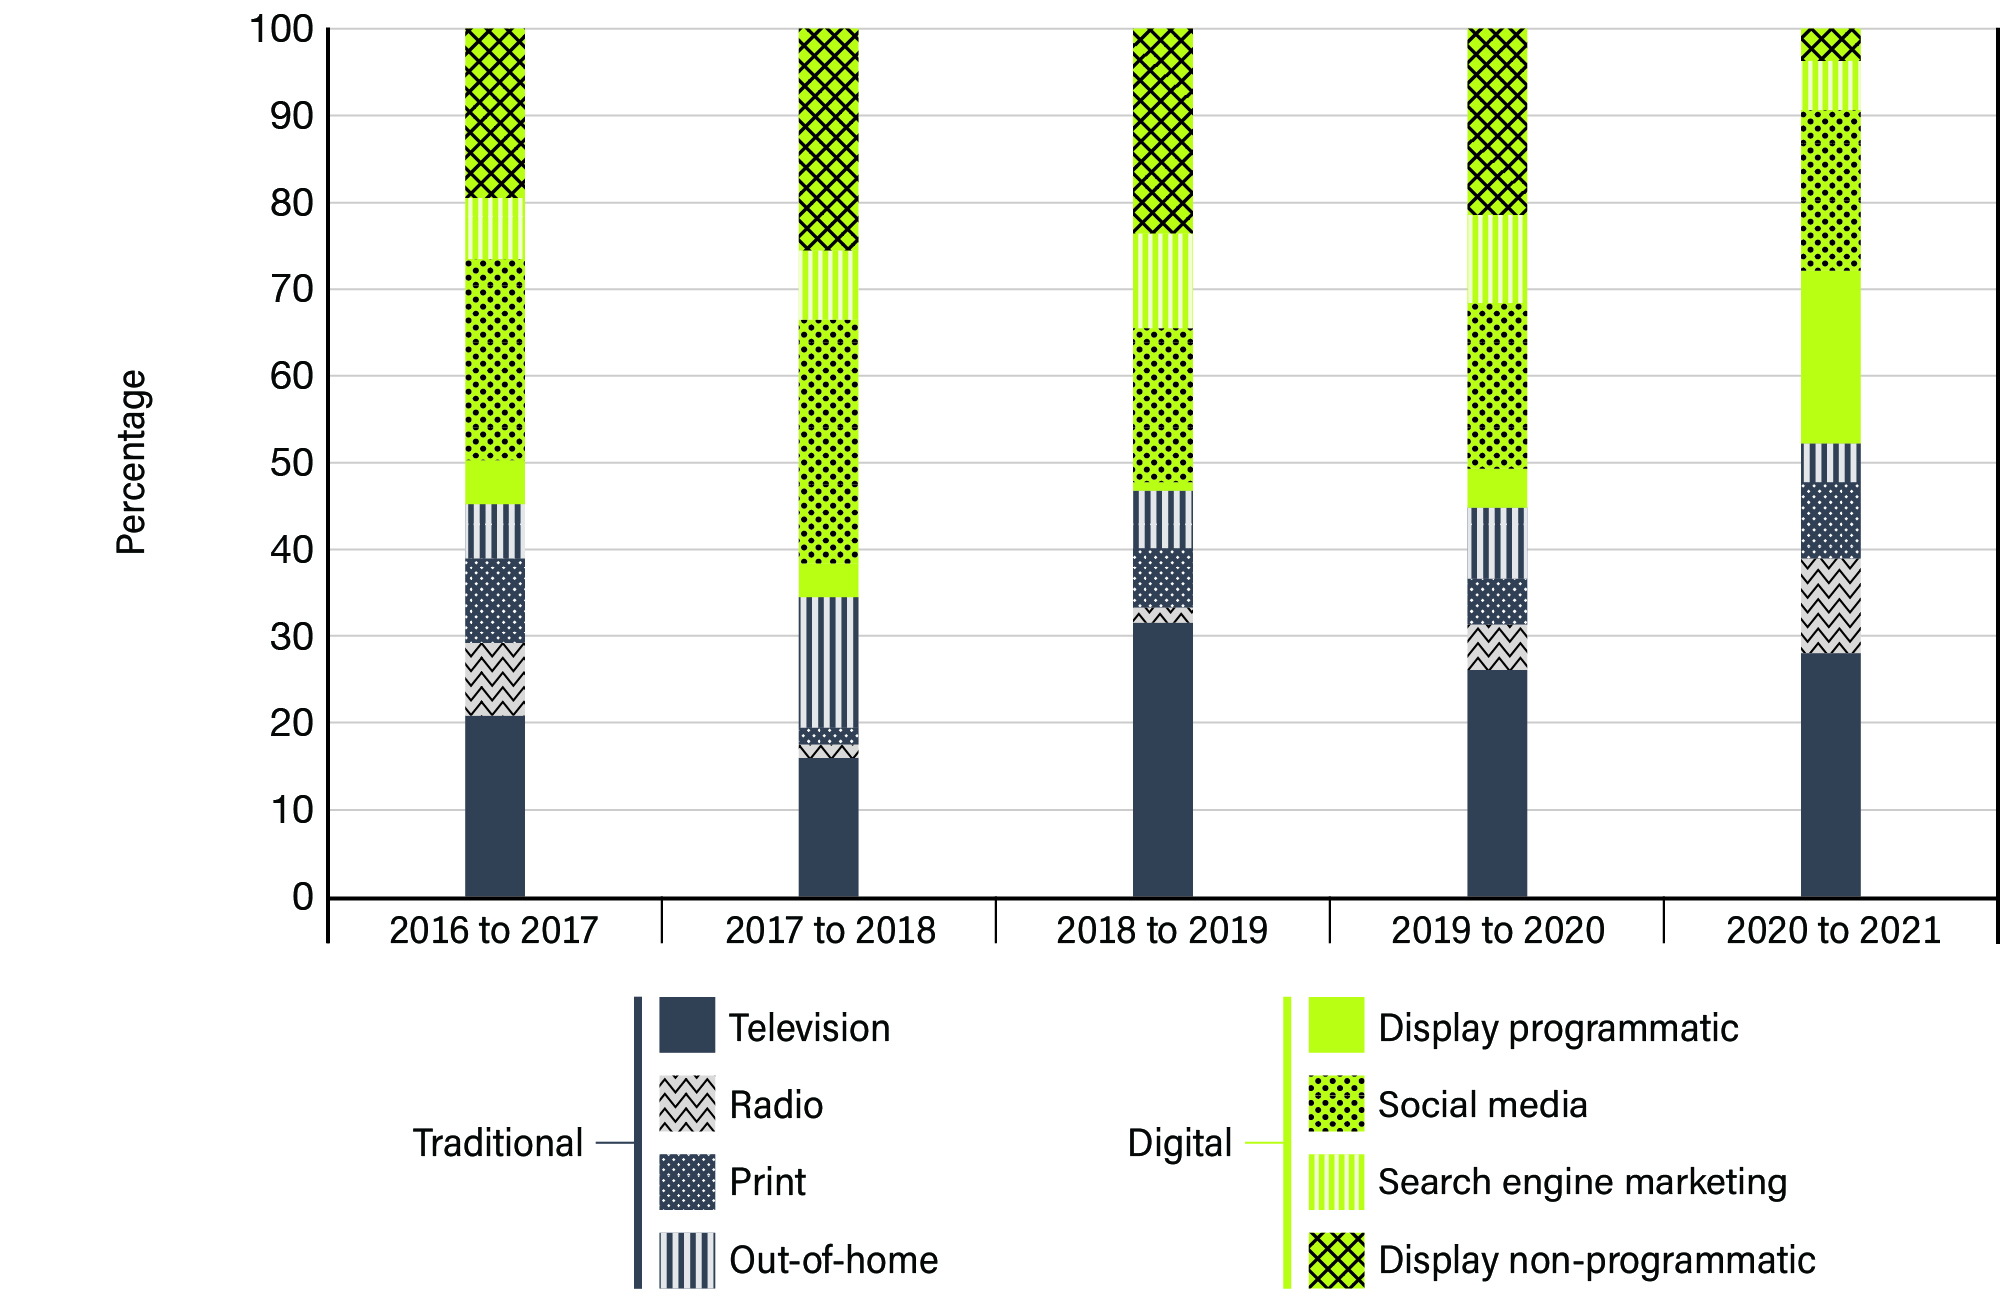
Image description
This vertical bar graphic presents the percentage distribution of total media expenditures in traditional and digital media by media type over five years, from fiscal year 2016 to 2017 to fiscal year 2020 to 2021. The traditional media types are television, radio, print and out-of-home. The digital media types are display programmatic, social media, search engine marketing and display non-programmatic. The graphic is provided for illustration purposes. The information illustrated by the graphic is the following:
| Media | 2016 to 2017 | 2017 to 2018 | 2018 to 2019 | 2019 to 2020 | 2020 to 2021 |
|---|---|---|---|---|---|
| Traditional | |||||
| Television | 21% | 16% | 32% | 26% | 28% |
| Radio | 9% | 1% | 2% | 5% | 11% |
| 10% | 2% | 7% | 5% | 9% | |
| Out-of-home | 6% | 15% | 7% | 8% | 5% |
| Digital | |||||
| Display programmatic | 5% | 4% | 1% | 4% | 20% |
| Social media | 23% | 28% | 18% | 19% | 19% |
| Search engine marketing | 7% | 8% | 11% | 10% | 5% |
| Display non-programmatic | 20% | 25% | 24% | 21% | 4% |
| Total | 100% | 100% | 100% | 100% | 100% |
Figure 7: Traditional media expenditures over 5 years

Image description
This vertical bar graphic presents traditional media expenditures by media type in millions of dollars over five years, from fiscal year 2016 to 2017 to fiscal year 2020 to 2021. The media types are television, radio, print and out-of-home. The graphic is for illustration purposes. The information illustrated by the graphic is the following:
| Media | 2016 to 2017 | 2017 to 2018 | 2018 to 2019 | 2019 to 2020 | 2020 to 2021 |
|---|---|---|---|---|---|
| Television | $6,377,972 | $4,470,942 | $13,575,701 | $11,737,577 | $30,125,369 |
| Radio | $2,618,111 | $391,916 | $799,671 | $2,352,370 | $11,590,073 |
| $2,938,610 | $570,196 | $2,921,078 | $2,385,990 | $9,312,472 | |
| Out-of-home | $1,928,330 | $4,177,134 | $2,818,896 | $3,671,456 | $4,966,913 |
| Total | $13,863,024 | $9,610,188 | $20,115,347 | $20,147,394 | $55,994,827 |
Figure 8: Distribution of traditional media expenditures over 5 years

Image description
This vertical bar graphic presents the percentage distribution of traditional media expenditures by media type over five years, from fiscal year 2016 to 2017 to fiscal year 2020 to 2021. The media types are television, radio, print and out-of-home. The graphic is for illustration purposes. The information illustrated by the graphic is the following:
| Media | 2016 to 2017 | 2017 to 2018 | 2018 to 2019 | 2019 to 2020 | 2020 to 2021 |
|---|---|---|---|---|---|
| Television | 46% | 47% | 67% | 58% | 54% |
| Radio | 19% | 4% | 4% | 12% | 21% |
| 21% | 6% | 15% | 12% | 17% | |
| Out-of-home | 14% | 43% | 14% | 18% | 9% |
| Total | 100% | 100% | 100% | 100% | 100% |
Figure 9: Digital media expenditures over 5 years
More information on social media expenditures is also provided in figure 11 and figure 12. Media placement on YouTube is included under Display programmatic. Search engine marketing media placement was made with three platforms. The largest share was allocated to Google receiving 86% ($5.05 million) of total media expenditures in this medium. The remaining was spent with Bing receiving 10% ($573 thousand) and Apple Search Ads receiving 4% ($258 thousand).

Image description
This vertical bar graphic presents digital media expenditures by media type in millions of dollars over five years, from fiscal year 2016 to 2017 to fiscal year 2020 to 2021. The media types are display programmatic, social media, search engine marketing and display non-programmatic. The graphic is provided for illustration purposes. The information illustrated by the graphic is the following:
| Media | 2016 to 2017 | 2017 to 2018 | 2018 to 2019 | 2019 to 2020 | 2020 to 2021 |
|---|---|---|---|---|---|
| Display programmatic | $1,533,108 | $1,074,858 | $435,430 | $1,955,100 | $21,144,891 |
| Social media | $7,125,264 | $7,755,521 | $7,617,926 | $8,561,088 | $19,905,460 |
| Search engine marketing | $2,124,167 | $2,258,743 | $4,739,636 | $4,570,668 | $5,883,032 |
| Display non-programmatic | $5,986,980 | $7,064,404 | $10,134,089 | $9,624,895 | $4,039,503 |
| Total | $16,769,519 | $18,153,526 | $22,927,081 | $24,711,751 | $50,972,886 |
Figure 10: Distribution of digital media expenditures over 5 years

Image description
This vertical bar graphic presents the percentage distribution of digital media expenditures by media type over five years, from fiscal year 2016 to 2017 to fiscal year 2020 to 2021. The media types are display programmatic, social media, search engine marketing and display non-programmatic. The graphic is provided for illustration purposes. The information illustrated by the graphic is the following:
| Media | 2016 to 2017 | 2017 to 2018 | 2018 to 2019 | 2019 to 2020 | 2020 to 2021 |
|---|---|---|---|---|---|
| Display programmatic | 9% | 6% | 2% | 8% | 41% |
| Social media | 42% | 43% | 33% | 35% | 39% |
| Search engine marketing | 13% | 12% | 21% | 18% | 12% |
| Display non-programmatic | 36% | 39% | 44% | 39% | 8% |
| Total | 100% | 100% | 100% | 100% | 100% |
Figure 11: Social media expenditures over 5 years

Image description
This vertical bar graphic presents social media expenditures by platform in millions of dollars over five years, from fiscal year 2016 to 2017 to fiscal year 2020 to 2021. The platforms are Facebook/Instagram, Twitter, Snapchat, LinkedIn, TikTok and Pinterest. The graphic is provided for illustration purposes. The information illustrated by the graphic is the following:
| Platform | 2016 to 2017 | 2017 to 2018 | 2018 to 2019 | 2019 to 2020 | 2020 to 2021 |
|---|---|---|---|---|---|
| Facebook/Instagram | $4,646,517 | $5,684,613 | $5,399,912 | $5,854,469 | $11,649,636 |
| $1,942,452 | $941,505 | $839,447 | $1,119,479 | $3,244,935 | |
| Snapchat | $0 | $406,845 | $565,814 | $920,635 | $2,867,196 |
| $536,295 | $722,559 | $812,753 | $666,505 | $1,501,624 | |
| TikTok | $0 | $0 | $0 | $0 | $377,019 |
| $0 | $0 | $0 | $0 | $265,048 | |
| Total | $7,125,264 | $7,755,521 | $7,617,926 | $8,561,088 | $19,905,460 |
Figure 12: Distribution of social media expenditures over 5 years

Image description
This vertical bar graphic presents the percentage distribution of social media expenditures by platform over five years, from fiscal year 2016 to 2017 to fiscal year 2020 to 2021. The platforms are Facebook/Instagram, Twitter, Snapchat, LinkedIn, TikTok and Pinterest. The graphic is provided for illustration purposes. The information illustrated by the graphic is the following:
| Platform | 2016 to 2017 | 2017 to 2018 | 2018 to 2019 | 2019 to 2020 | 2020 to 2021 |
|---|---|---|---|---|---|
| Facebook/Instagram | 65% | 73% | 71% | 68% | 59% |
| 27% | 12% | 11% | 13% | 16% | |
| Snapchat | 0% | 5% | 7% | 11% | 14% |
| 8% | 9% | 11% | 8% | 8% | |
| TikTok | 0% | 0% | 0% | 0% | 2% |
| 0% | 0% | 0% | 0% | 1% | |
| Total | 100% | 100% | 100% | 100% | 100% |
Figure 13: Media expenditures by quarter over 5 years

Image description
This vertical bar graphic presents total media expenditures by fiscal year quarter in millions of dollars over five years, from fiscal year 2016 to 2017 to fiscal year 2020 to 2021. The fiscal year quarters are April to June, July to September, October to December and January to March. The graphic is provided for illustration purposes. The information illustrated by the graphic is the following:
| Fiscal year quarter | 2016 to 2017 | 2017 to 2018 | 2018 to 2019 | 2019 to 2020 | 2020 to 2021 |
|---|---|---|---|---|---|
| April to June | $9,707,078 | $2,024,184 | $2,991,500 | $31,189,476 | $20,495,792 |
| July to September | $297,333 | $2,412,338 | $3,051,747 | $277,813 | $7,787,842 |
| October to December | $3,014,958 | $7,353,217 | $15,346,757 | $2,808,375 | $33,501,262 |
| January to March | $17,613,174 | $15,973,975 | $21,652,423 | $10,583,481 | $45,182,816 |
| Total | $30,632,543 | $27,763,715 | $43,042,428 | $44,859,145 | $106,967,712 |
Figure 14: Distribution of media expenditures by quarter over 5 years

Image description
This vertical bar graphic presents the percentage distribution of total media expenditures by fiscal year quarter over five years, from fiscal year 2016 to 2017 to fiscal year 2020 to 2021. The fiscal year quarters are April to June, July to September, October to December and January to March. The graphic is provided for illustration purposes. The information illustrated by the graphic is the following:
| Fiscal year quarter | 2016 to 2017 | 2017 to 2018 | 2018 to 2019 | 2019 to 2020 | 2020 to 2021 |
|---|---|---|---|---|---|
| April to June | 32% | 7% | 7% | 70% | 19% |
| July to September | 1% | 9% | 7% | 1% | 7% |
| October to December | 10% | 26% | 36% | 6% | 31% |
| January to March | 57% | 58% | 50% | 24% | 42% |
| Total | 100% | 100% | 100% | 100% | 100% |
Official languages
Reaching Canadians in the official language of their choice, regardless of where they reside, is a mandatory requirement for GC advertising. All media plans are developed, reviewed and approved in accordance with this requirement. The tables below include all media placement for advertisements in English and French during fiscal year 2020 to 2021. Table 1 provides an overview of the total media expenditures and tables 2 and 3 provide details on traditional and digital media expenditures.
The attribution of expenditures by official language is based on the following:
- Internet: The language of the ads.
- Television and radio: The broadcast language of the stations.
- Out-of-home: The predominant language of each province, except for cinema, which is based on the proportion of screens in each language, in each province or market.
- Print: The language of the ads.
| Media | English | French | Total | ||
|---|---|---|---|---|---|
| Expenditures | Distribution | Expenditures | Distribution | ||
| Traditional | $44,130,381 | 81% | $10,579,893 | 19% | $54,710,274 |
| Digital | $37,353,446 | 75% | $12,742,055 | 25% | $50,095,501 |
| Total | $81,483,826 | 78% | $23,321,949 | 22% | $104,805,775 |
| Media | English | French | Total | ||
|---|---|---|---|---|---|
| Expenditures | Distribution | Expenditures | Distribution | ||
| Television | $26,279,623 | 87% | $3,845,746 | 13% | $30,125,369 |
| Radio | $8,962,795 | 78% | $2,596,727 | 22% | $11,559,522 |
| $6,404,506 | 79% | $1,653,963 | 21% | $8,058,470 | |
| Out-of-home | $2,483,456 | 50% | $2,483,457 | 50% | $4,966,913 |
| Total | $44,130,381 | 81% | $10,579,893 | 19% | $54,710,274 |
| Media | English | French | Total | ||
|---|---|---|---|---|---|
| Expenditures | Distribution | Expenditures | Distribution | ||
| Display programmatic | $15,453,587 | 74% | $5,292,944 | 26% | $20,746,531 |
| Social media | $14,864,633 | 75% | $4,988,015 | 25% | $19,852,647 |
| Search engine marketing | $4,129,805 | 76% | $1,327,014 | 24% | $5,456,820 |
| Display non-programmatic | $2,905,421 | 72% | $1,134,082 | 28% | $4,039,503 |
| Total | $37,353,446 | 75% | $12,742,055 | 25% | $50,095,501 |
Ethnic and Indigenous media
Ethnic and Indigenous media are also used to reach ethnic and Indigenous audiences. The media are multilingual and can include advertisements in various languages as well as English and French. Amounts in the tables below include all media placement within Canada during fiscal year 2020 to 2021. Table 4 provides an overview of the total media expenditures and tables 5 and 6 provide details on traditional and digital media expenditures.
| Media | Ethnic | Indigenous | ||
|---|---|---|---|---|
| Expenditures | Distribution | Expenditures | Distribution | |
| Traditional | $4,377,369 | 75% | $2,364,859 | 54% |
| Digital | $1,489,013 | 25% | $1,997,726 | 46% |
| Total | $5,866,382 | 100% | $4,362,585 | 100% |
| Media | Ethnic | Indigenous | ||
|---|---|---|---|---|
| Expenditures | Distribution | Expenditures | Distribution | |
| Television | $1,734,259 | 40% | $693,723 | 29% |
| Radio | $1,080,079 | 25% | $1,583,738 | 67% |
| $1,563,032 | 36% | $87,398 | 4% | |
| Out-of-home | $0 | 0% | $0 | 0% |
| Total | $4,377,369 | 100% | $2,364,859 | 100% |
| Media | Ethnic | Indigenous | ||
|---|---|---|---|---|
| Expenditures | Distribution | Expenditures | Distribution | |
| Display programmatic | $1,123,528 | 75% | $626,412 | 31% |
| Social media | $306,087 | 21% | $1,105,421 | 55% |
| Search engine marketing | $0 | 0% | $25,406 | 1% |
| Display non-programmatic | $59,397 | 4% | $240,487 | 12% |
| Total | $1,489,013 | 100% | $1,997,726 | 100% |
International audiences
During fiscal year 2020 to 2021, media placement targeting international audiences totalling $1,144,584 was made by the AOR for Global Affairs Canada. This included advertisements in various languages as well as English in French. An amount of $955,531 was spent on search engine marketing media placement to raise awareness of Canadian educational institutions in various countries. The remaining amount, $189,053, was allocated to search engine marketing ($143,708), display programmatic ($44,245) and print ($1,100) media in the United States and Europe, to provide information related to travel and border restrictions for Canada.
COVID-19
The tables below provide information on media expenditures associated with COVID-19 campaigns that ran during fiscal year 2020 to 2021 (ending March 31, 2021). This includes all placement made through the AOR on behalf of GC institutions, including the Public Health Agency of Canada, the Department of Finance Canada and Employment and Social Development Canada. Amounts are net media costs paid to suppliers for the purchase of advertising space and time. Fees paid to the AOR to perform the media placement, as well as media planning and creative production costs are excluded. Table 7 provides an overview of the media expenditures and tables 8 and 9 provide details on traditional and digital media expenditures. This information has been compiled for the annual report on an exceptional basis since the situation with the pandemic is unique and historic.
Advertising associated with COVID-19 was initially launched at the end of the previous fiscal year (2019 to 2020), which included media placement through the AOR totalling $4.50 million. For more information on the expenditures reported in the previous fiscal year, consult the Annual report on Government of Canada advertising activities 2019 to 2020.
| Media | Expenditures | Distribution |
|---|---|---|
| Traditional | $45,393,886 | 62% |
| Digital | $27,411,179 | 38% |
| Total | $72,805,066 | 100% |
| Media | Expenditures | Distribution |
|---|---|---|
| Television | $22,760,083 | 50% |
| Radio | $10,119,303 | 22% |
| $7,960,530 | 18% | |
| Out-of-home | $4,553,971 | 10% |
| Total | $45,393,886 | 100% |
| Media | Expenditures | Distribution |
|---|---|---|
| Display programmatic | $12,232,032 | 45% |
| Social media | $10,980,822 | 40% |
| Search engine marketing | $2,305,194 | 8% |
| Display non-programmatic | $1,893,131 | 7% |
| Total | $27,411,179 | 100% |
- Date modified: